- Power BI forums
- Updates
- News & Announcements
- Get Help with Power BI
- Desktop
- Service
- Report Server
- Power Query
- Mobile Apps
- Developer
- DAX Commands and Tips
- Custom Visuals Development Discussion
- Health and Life Sciences
- Power BI Spanish forums
- Translated Spanish Desktop
- Power Platform Integration - Better Together!
- Power Platform Integrations (Read-only)
- Power Platform and Dynamics 365 Integrations (Read-only)
- Training and Consulting
- Instructor Led Training
- Dashboard in a Day for Women, by Women
- Galleries
- Community Connections & How-To Videos
- COVID-19 Data Stories Gallery
- Themes Gallery
- Data Stories Gallery
- R Script Showcase
- Webinars and Video Gallery
- Quick Measures Gallery
- 2021 MSBizAppsSummit Gallery
- 2020 MSBizAppsSummit Gallery
- 2019 MSBizAppsSummit Gallery
- Events
- Ideas
- Custom Visuals Ideas
- Issues
- Issues
- Events
- Upcoming Events
- Community Blog
- Power BI Community Blog
- Custom Visuals Community Blog
- Community Support
- Community Accounts & Registration
- Using the Community
- Community Feedback
Register now to learn Fabric in free live sessions led by the best Microsoft experts. From Apr 16 to May 9, in English and Spanish.
- Power BI forums
- Forums
- Get Help with Power BI
- Desktop
- Creating cumulative measure based on dynamic ranki...
- Subscribe to RSS Feed
- Mark Topic as New
- Mark Topic as Read
- Float this Topic for Current User
- Bookmark
- Subscribe
- Printer Friendly Page
- Mark as New
- Bookmark
- Subscribe
- Mute
- Subscribe to RSS Feed
- Permalink
- Report Inappropriate Content
Creating cumulative measure based on dynamic ranking / Dynamic running total/pareto diagram-measure
Hi,
I have a very interesting problem I believe:
I need help with creating dynamic totals/pareto diagram on suppliers based on sales, and categorize the supplier in categories based on their acculmulated sales. I.e a A supplier is one of the supplier in the interval of 0-80% accumulated sales (ABC-analysis).
My data is a large table with all the spend of a company. This means multiple rows per supplier containing all single purhaces from all suppliers, including what year the purchase was made.
I have done quite som googling and know about the solution calculate(sum(sales),allselect(date,date<=max date))). However this does not work on my table as I want the ranking/cumulative sales/category/ to change in the report with.
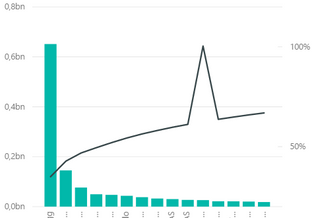
This was the result when using the above formula, but the result does not care about what year is selected. (The peak is just a double entry error in the data set)
Now, the main issue as I understand it:
I have made a dynamic ranking measure with the formula Ranking1 = RANKX(ALLSELECTED('Sales'[SupplierID]);CALCULATE(SUM('Sales'[Sales]))), and it works great. I also have dynamic sum measures, and percentage of total spend per supplier, all dynamic with year selected.
The problem is when I try to accumulate the percentages to create a pareto diagram as I did above (I followed this receipe to create the "static" pareto https://powerbi.tips/2016/10/pareto-charting/). Is is not possible to create a cumulated measure based on a ranking measure as I understand. This is what I want to work:
**bleep**. total = CALCULATE(SUM('Sales[Sales]);FILTER(ALLSELECTED('Sales');[Ranking1] <= MAX([Ranking1]))). However this gives the error on the max function, because it cannot calculate max on the measure.
This is the dynamic results I have so far, but I have no way of cumulating the percetages og categorixing suppliers based on them..
Any help would be greatly appreciated!
Solved! Go to Solution.
- Mark as New
- Bookmark
- Subscribe
- Mute
- Subscribe to RSS Feed
- Permalink
- Report Inappropriate Content
Hi, try reviewing this blog's post.
Is in spanish but i hope can help you.
Regards
Victor
Lima - Peru
Lima - Peru
- Mark as New
- Bookmark
- Subscribe
- Mute
- Subscribe to RSS Feed
- Permalink
- Report Inappropriate Content
Hi,
You may refer to my solution in this workbook. There is one problem that when i select 2015 in the slicer, i get the result for "B" as 2 whereas it should be 3. I cannot figure out why that is happening. Hope someone else can pitch in.
Regards,
Ashish Mathur
http://www.ashishmathur.com
https://www.linkedin.com/in/excelenthusiasts/
Helpful resources

Microsoft Fabric Learn Together
Covering the world! 9:00-10:30 AM Sydney, 4:00-5:30 PM CET (Paris/Berlin), 7:00-8:30 PM Mexico City

Power BI Monthly Update - April 2024
Check out the April 2024 Power BI update to learn about new features.

| User | Count |
|---|---|
| 109 | |
| 98 | |
| 77 | |
| 66 | |
| 54 |
| User | Count |
|---|---|
| 144 | |
| 104 | |
| 100 | |
| 86 | |
| 64 |


