cancel
Showing results for 
Search instead for 
Did you mean: 

Register now to learn Fabric in free live sessions led by the best Microsoft experts. From Apr 16 to May 9, in English and Spanish.

Reply
topkatt
Frequent Visitor

Create Visualizations USING Table with Last Observation per ID

Hi all. I'm looking to create a table that has the last observation per ID with respect to the date currently selected in a slicer (specfically, in a Play Axis dynamic slicer). I've gotten help enough to construct a visualization of the table I'm looking for, but I'm not sure how to create the same table in an abstract sense, so that I'm able to build visualizations from the resulting data.


As an example, consider the data below.


IDTypeDateLocation
23CREATED10/23/17 7:39 AMBoston
23UPDATED12/28/17 9:23 PMBoston
23DELIVERED5/18/18 4:27 PMNew York
32CREATED10/31/17 10:56 AMLA
32CANCELED11/15/17 1:27 PMLA
32CREATED12/31/17 9:10 PMLA
32UPDATED12/31/17 9:10 PMLA
32DELIVERED6/16/18 4:26 PMSan Diego
71CREATED5/22/18 4:14 PMDallas
71CANCELED5/22/18 5:19 PMDallas
217CREATED11/29/17 7:41 AMBoston
217UPDATED12/28/17 9:23 PMBoston
217DELIVERED5/19/18 4:27 PMDallas
227CREATED12/15/17 8:02 AMNew York
227RESCHEDULED12/21/17 8:42 PMNew York
227UPDATED12/28/17 9:27 PMNew York
227RESCHEDULED1/16/18 1:50 PMNew York
227UPDATED1/17/18 1:36 PMNew York
227DELIVERED4/6/18 2:03 PMNew York
227CREATED10/18/17 8:16 AMNew York
227UPDATED12/28/17 9:45 PMNew York
227RESCHEDULED1/1/18 4:40 PMNew York
227UPDATED1/3/18 6:05 AMNew York
227DELIVERED4/6/18 1:57 PMNew York


I want to create a table that has the last observation per ID that is on or before the date currently selected in the slicer. For instance, if the date in the slicer were 5/5/2018, the resulting table would be as follows:


IDTypeDateLocation
23UPDATED12/28/17 9:23 PMBoston
32UPDATED12/31/17 9:10 PMLA
217UPDATED12/28/17 9:23 PMBoston
227DELIVERED4/6/18 2:03 PMNew York


Again, I've been able to create a visualization of the above table, but I'm looking to create visualizations from the data contained in the above table.


Thanks for your help!

4 REPLIES 4
v-jiascu-msft
Employee
Employee

Hi @topkatt,


Could you please mark the proper answers as solutions?


Best Regards,

Dale

Community Support Team _ Dale
If this post helps, then please consider Accept it as the solution to help the other members find it more quickly.
v-jiascu-msft
Employee
Employee

Hi @topkatt,


Please check out the demo in the attachment.

Measure =
VAR maxDate =
    CALCULATE (
        MAX ( 'Table1'[Date] ),
        FILTER (
            ALLEXCEPT ( Table1, Table1[ID] ),
            'Table1'[Dates] <= SELECTEDVALUE ( 'Calendar'[Date] )
                && 'Table1'[Type] IN { "UPDATED", "DELIVERED" }
        )
    )
RETURN
    IF (
        MIN ( 'Table1'[Date] ) = maxDate
            && MIN ( 'Table1'[Type] ) IN { "UPDATED", "DELIVERED" },
        1,
        BLANK ()
    )

Create-Visualizations-USING-Table-with-Last-Observation-per-ID

Best Regards,
Dale

Community Support Team _ Dale
If this post helps, then please consider Accept it as the solution to help the other members find it more quickly.


@v-jiascu-msft wrote:

Hi @topkatt,


Please check out the demo in the attachment.

Measure =
VAR maxDate =
    CALCULATE (
        MAX ( 'Table1'[Date] ),
        FILTER (
            ALLEXCEPT ( Table1, Table1[ID] ),
            'Table1'[Dates] <= SELECTEDVALUE ( 'Calendar'[Date] )
                && 'Table1'[Type] IN { "UPDATED", "DELIVERED" }
        )
    )
RETURN
    IF (
        MIN ( 'Table1'[Date] ) = maxDate
            && MIN ( 'Table1'[Type] ) IN { "UPDATED", "DELIVERED" },
        1,
        BLANK ()
    )

Create-Visualizations-USING-Table-with-Last-Observation-per-ID

Best Regards,
Dale


Dale,


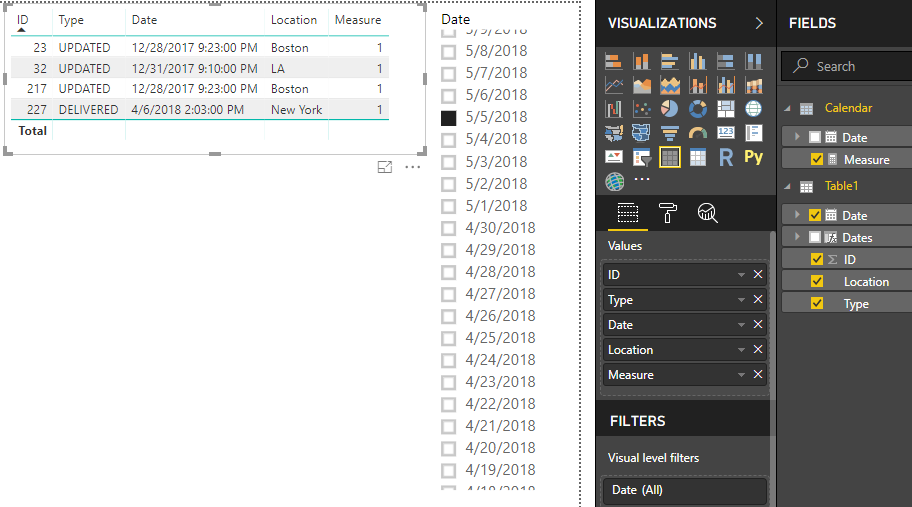
Thanks for your help here. Your solution successfully creates a visualization of the table I was describing, but what I'm looking to do is create visualizations based on the data in this table. E.g. based on the data in the example, if I wanted to create a map of unique ID's per location, the map would show three locations: Boston with size 2, and New York and LA each with size 1.


As a side note, I notice that you're hard-coding the "Type" being equal to either "Updated" or "Delivered", but I'd like to include the latest record for each ID regardless of the "Type".


Thanks again for all your help.

Hi @topkatt,


1. Since we can't add much more context in the Map, try this measure, please. 

Measure 2 =
SUMX (
    SUMMARIZE (
        'Table1',
        Table1[ID],
        Table1[Type],
        Table1[Location],
        Table1[Date],
        "m", [Measure]
    ),
    [m]
)

Create-Visualizations-USING-Table-with-Last-Observation-per-ID2


2. Why did I hardcode the conditions? Because the actual result is different from yours in the first post. Please refer to the snapshot below.


Create-Visualizations-USING-Table-with-Last-Observation-per-ID3


Best Regards,
Dale

Community Support Team _ Dale
If this post helps, then please consider Accept it as the solution to help the other members find it more quickly.

Helpful resources

Announcements
Microsoft Fabric Learn Together

Microsoft Fabric Learn Together

Covering the world! 9:00-10:30 AM Sydney, 4:00-5:30 PM CET (Paris/Berlin), 7:00-8:30 PM Mexico City

PBI_APRIL_CAROUSEL1

Power BI Monthly Update - April 2024

Check out the April 2024 Power BI update to learn about new features.

April Fabric Community Update

Fabric Community Update - April 2024

Find out what's new and trending in the Fabric Community.