- Power BI forums
- Updates
- News & Announcements
- Get Help with Power BI
- Desktop
- Service
- Report Server
- Power Query
- Mobile Apps
- Developer
- DAX Commands and Tips
- Custom Visuals Development Discussion
- Health and Life Sciences
- Power BI Spanish forums
- Translated Spanish Desktop
- Power Platform Integration - Better Together!
- Power Platform Integrations (Read-only)
- Power Platform and Dynamics 365 Integrations (Read-only)
- Training and Consulting
- Instructor Led Training
- Dashboard in a Day for Women, by Women
- Galleries
- Community Connections & How-To Videos
- COVID-19 Data Stories Gallery
- Themes Gallery
- Data Stories Gallery
- R Script Showcase
- Webinars and Video Gallery
- Quick Measures Gallery
- 2021 MSBizAppsSummit Gallery
- 2020 MSBizAppsSummit Gallery
- 2019 MSBizAppsSummit Gallery
- Events
- Ideas
- Custom Visuals Ideas
- Issues
- Issues
- Events
- Upcoming Events
- Community Blog
- Power BI Community Blog
- Custom Visuals Community Blog
- Community Support
- Community Accounts & Registration
- Using the Community
- Community Feedback
Register now to learn Fabric in free live sessions led by the best Microsoft experts. From Apr 16 to May 9, in English and Spanish.
- Power BI forums
- Forums
- Get Help with Power BI
- Desktop
- Re: Count
- Subscribe to RSS Feed
- Mark Topic as New
- Mark Topic as Read
- Float this Topic for Current User
- Bookmark
- Subscribe
- Printer Friendly Page
- Mark as New
- Bookmark
- Subscribe
- Mute
- Subscribe to RSS Feed
- Permalink
- Report Inappropriate Content
Count
Hi,
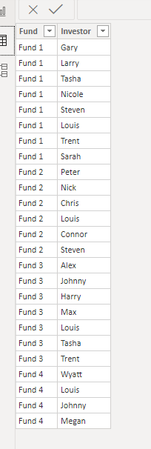
I am struggling to visually show how many repeat investors there are in my data for different funds. I have made a sample data set here:
My goal is when I input another fund into this data, I can check that new funds investors against all of the investors that I already have. For example, I want to see if there are any matches between Fund 4's investors and the rest of the fund's investors. When I try a pivot table, it will show the column "Count of Investors" as 1 under the Fund 4's name "Louis", even though the name Louis is already in the data set multiple times in different funds:
I would really appreciate any help I could get, as I am fairly new at Power BI and have spent countless hours trying to figure this out. Thank you
Solved! Go to Solution.
- Mark as New
- Bookmark
- Subscribe
- Mute
- Subscribe to RSS Feed
- Permalink
- Report Inappropriate Content
Hi @Anonymous ,
Just a small change to @mahoneypat formula for your desired result.
Fund Count =
IF (
    ISINSCOPE ( 'Table'[Name] ),
    CALCULATE (
        DISTINCTCOUNT ( 'Table'[Fund] ),
        ALL ( 'Table'[Fund] )
    ),
    CALCULATE (
        COUNT ( 'Table'[Fund] )
    )
)
Regards,
Harsh Nathani
Appreciate with a Kudos!! (Click the Thumbs Up Button)
Did I answer your question? Mark my post as a solution!
- Mark as New
- Bookmark
- Subscribe
- Mute
- Subscribe to RSS Feed
- Permalink
- Report Inappropriate Content
You could write a Fund Count measure like this and use it instead of your count measure.
Fund Count =
CALCULATE ( DISTINCTCOUNT ( Table[Fund] ), ALL ( Table[Fund] ) )
If this works for you, please mark it as the solution. Kudos are appreciated too. Please let me know if not.
Regards,
Pat
Did I answer your question? Mark my post as a solution! Kudos are also appreciated!
To learn more about Power BI, follow me on Twitter or subscribe on YouTube.
@mahoneypa HoosierBI on YouTube
- Mark as New
- Bookmark
- Subscribe
- Mute
- Subscribe to RSS Feed
- Permalink
- Report Inappropriate Content
Thank you @mahoneypat
This worked for the individual fund names, however, it says there are 4 investors in each of the funds. Is there a way to have that show the actual amount?
Like shown in the picture below, it says 4 for all of them, when clearly there are 7 investors in Fund 3.
- Mark as New
- Bookmark
- Subscribe
- Mute
- Subscribe to RSS Feed
- Permalink
- Report Inappropriate Content
Hi @Anonymous ,
Just a small change to @mahoneypat formula for your desired result.
Fund Count =
IF (
    ISINSCOPE ( 'Table'[Name] ),
    CALCULATE (
        DISTINCTCOUNT ( 'Table'[Fund] ),
        ALL ( 'Table'[Fund] )
    ),
    CALCULATE (
        COUNT ( 'Table'[Fund] )
    )
)
Regards,
Harsh Nathani
Appreciate with a Kudos!! (Click the Thumbs Up Button)
Did I answer your question? Mark my post as a solution!
- Mark as New
- Bookmark
- Subscribe
- Mute
- Subscribe to RSS Feed
- Permalink
- Report Inappropriate Content
I also tried to do it this way:
I edited the interactions so that the top left slicer (Fund) would filter the bottom left slicer(investor), but when I click "select all" on the bottom left slicer, it gives me all of the investors name in that matrix, not just Fund 1's investors.
Helpful resources

Microsoft Fabric Learn Together
Covering the world! 9:00-10:30 AM Sydney, 4:00-5:30 PM CET (Paris/Berlin), 7:00-8:30 PM Mexico City

Power BI Monthly Update - April 2024
Check out the April 2024 Power BI update to learn about new features.

| User | Count |
|---|---|
| 114 | |
| 100 | |
| 78 | |
| 75 | |
| 52 |
| User | Count |
|---|---|
| 144 | |
| 109 | |
| 108 | |
| 88 | |
| 61 |


