- Power BI forums
- Updates
- News & Announcements
- Get Help with Power BI
- Desktop
- Service
- Report Server
- Power Query
- Mobile Apps
- Developer
- DAX Commands and Tips
- Custom Visuals Development Discussion
- Health and Life Sciences
- Power BI Spanish forums
- Translated Spanish Desktop
- Power Platform Integration - Better Together!
- Power Platform Integrations (Read-only)
- Power Platform and Dynamics 365 Integrations (Read-only)
- Training and Consulting
- Instructor Led Training
- Dashboard in a Day for Women, by Women
- Galleries
- Community Connections & How-To Videos
- COVID-19 Data Stories Gallery
- Themes Gallery
- Data Stories Gallery
- R Script Showcase
- Webinars and Video Gallery
- Quick Measures Gallery
- 2021 MSBizAppsSummit Gallery
- 2020 MSBizAppsSummit Gallery
- 2019 MSBizAppsSummit Gallery
- Events
- Ideas
- Custom Visuals Ideas
- Issues
- Issues
- Events
- Upcoming Events
- Community Blog
- Power BI Community Blog
- Custom Visuals Community Blog
- Community Support
- Community Accounts & Registration
- Using the Community
- Community Feedback
Register now to learn Fabric in free live sessions led by the best Microsoft experts. From Apr 16 to May 9, in English and Spanish.
- Power BI forums
- Forums
- Get Help with Power BI
- Desktop
- Count status with conditional dates
- Subscribe to RSS Feed
- Mark Topic as New
- Mark Topic as Read
- Float this Topic for Current User
- Bookmark
- Subscribe
- Printer Friendly Page
- Mark as New
- Bookmark
- Subscribe
- Mute
- Subscribe to RSS Feed
- Permalink
- Report Inappropriate Content
Count status with conditional dates
Hi, I have a challenge and I need your help.
I have a status log per tasks, in which I have the record of the changes status of each task.
For example, task "A" goes through states 1, 2 and 3 at such times.
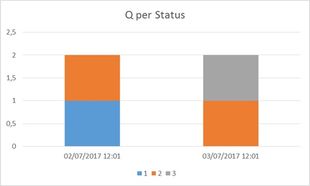
What I want to achieve, is to be able to graph the number of tasks in each state at a certain moment, at a certain moment of time should show the last state of each task before that time.
For example, in the following graph I show the quantities in the table above.
The challenge is to be able to explore by month, day and hours and count the status for each time.
Solved! Go to Solution.
- Mark as New
- Bookmark
- Subscribe
- Mute
- Subscribe to RSS Feed
- Permalink
- Report Inappropriate Content
In this scenario, I assume you have a Date/Time to get those certain moments. However, since there's no direct relationship between these certain moments and your source table. You can't include the fields from these two tables into same chart visual.
For your requirement, you can only create a slicer for those certain moments, the build a measure to get the last status for each task.
Last Status =
var MaxTime = CALCULATE(MAX(Table3[Time]),FILTER(Table3,Table3[Time]<=MAX(Table4[Time])))
return
CALCULATE(MAX(Table3[Status]),FILTER(Table3,Table3[Time]=MaxTime))
And to calculate the number of tasks for each status, we have to summarize above table into calculated table. However, it's not possible to generate a dynamic table. And we can't assign different aggregation on different hierarchy level. So these calculation can't be explored on different level.
Rergards,
Helpful resources

Microsoft Fabric Learn Together
Covering the world! 9:00-10:30 AM Sydney, 4:00-5:30 PM CET (Paris/Berlin), 7:00-8:30 PM Mexico City

Power BI Monthly Update - April 2024
Check out the April 2024 Power BI update to learn about new features.

| User | Count |
|---|---|
| 109 | |
| 96 | |
| 77 | |
| 66 | |
| 54 |
| User | Count |
|---|---|
| 144 | |
| 104 | |
| 102 | |
| 88 | |
| 63 |


