- Power BI forums
- Updates
- News & Announcements
- Get Help with Power BI
- Desktop
- Service
- Report Server
- Power Query
- Mobile Apps
- Developer
- DAX Commands and Tips
- Custom Visuals Development Discussion
- Health and Life Sciences
- Power BI Spanish forums
- Translated Spanish Desktop
- Power Platform Integration - Better Together!
- Power Platform Integrations (Read-only)
- Power Platform and Dynamics 365 Integrations (Read-only)
- Training and Consulting
- Instructor Led Training
- Dashboard in a Day for Women, by Women
- Galleries
- Community Connections & How-To Videos
- COVID-19 Data Stories Gallery
- Themes Gallery
- Data Stories Gallery
- R Script Showcase
- Webinars and Video Gallery
- Quick Measures Gallery
- 2021 MSBizAppsSummit Gallery
- 2020 MSBizAppsSummit Gallery
- 2019 MSBizAppsSummit Gallery
- Events
- Ideas
- Custom Visuals Ideas
- Issues
- Issues
- Events
- Upcoming Events
- Community Blog
- Power BI Community Blog
- Custom Visuals Community Blog
- Community Support
- Community Accounts & Registration
- Using the Community
- Community Feedback
Register now to learn Fabric in free live sessions led by the best Microsoft experts. From Apr 16 to May 9, in English and Spanish.
- Power BI forums
- Forums
- Get Help with Power BI
- Desktop
- Conditionally Sum or Average a Column based on dim...
- Subscribe to RSS Feed
- Mark Topic as New
- Mark Topic as Read
- Float this Topic for Current User
- Bookmark
- Subscribe
- Printer Friendly Page
- Mark as New
- Bookmark
- Subscribe
- Mute
- Subscribe to RSS Feed
- Permalink
- Report Inappropriate Content
Conditionally Sum or Average a Column based on dimension table values
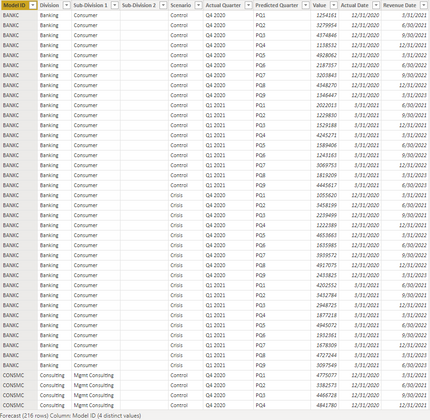
Hello, I have a fact table that contains Forecast data for particular business divisions. The forecast works as such: On the last day of the quarter, there are 9 future quarters that provide forecasted values. So, for Q4 2020 (12/31/2021), the first predicted quarter (PQ1) is 3/31/2022. Here's a snapshot of the Forecast Data Table:
This data has two Prediction Begin-From Dates: Q4 2020 and Q1 2021. For some of the Model ID's, we want to Sum up PQ1->PQ9 for each Sub-Division 2. For other Model ID's, we want to Average PQ1->PQ9 for each Sub-Division 2. That's determined by this table:
But once we have that 9Q Calculation for each Sub-Division 2, we want to Sum them all up. Here's the data model:
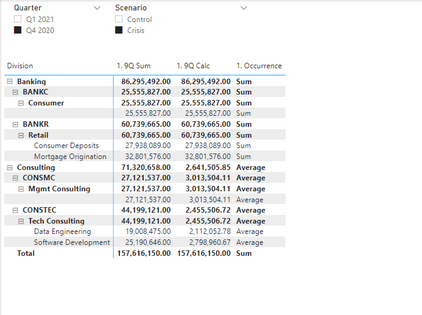
And the output matrix below:
So, I'm getting the correct measure (Average) at the level of CONSTEC -> Tech Consulting -> Data Engineering and CONSTEC -> Tech Consulting -> Software Development, but then Data Engineering and Software Development are also being aggregated by Average(), which I don't want. I want them to be aggregated by Sum. Just the lowest level should be aggregated by Average() if the model Calculation Type demands it. Otherwise, aggreagate by sum.
This is how I'm currently doing my measures:
1. 9Q Sum = SUM('Forecast'[Values])
2. 9Q Calc = IF(MAX('1_model_calc'[Calculation Type]) = "Sum", SUM('Forecast'[Values]), AVERAGE('Forecast'[Values])
So, how can I choose to use either AVERAGE() or SUM(), only at a particular level (and then just use SUM() everywhere else)?
Can anyone please give me some pointers for this? I tried using IF(ISINSCOPE(Sub-Division 2) && CalculationType = "Average", AVERAGE(), SUM()) to get the conditional average or sum only at the bottom level, but I wasn't getting the output I wanted. Should I use SUMX() with the IF Statement? I was experimenting with SUMX() of a SUMMARIZE(), but didn't get anywhere with that either. Thank you!
Solved! Go to Solution.
- Mark as New
- Bookmark
- Subscribe
- Mute
- Subscribe to RSS Feed
- Permalink
- Report Inappropriate Content
Hi @fourmj
Please try
MyMeasure =
IF (
    MAX ( '1_model_calc'[Calculation Type] ) = "Average",
    SUMX (
        VALUES ( 'Forecast'[Sub-Division2] ),
        CALCULATE ( AVERAGE ( 'Forecast'[Values] ) )
    ),
    SUM ( 'Forecast'[Values] )
)- Mark as New
- Bookmark
- Subscribe
- Mute
- Subscribe to RSS Feed
- Permalink
- Report Inappropriate Content
Thank you, this measure works. I also tried it on a different set of data that is similar to the sample data in this post and it worked with some modification.
Thank you for providing me with insight on solving this problem.
- Mark as New
- Bookmark
- Subscribe
- Mute
- Subscribe to RSS Feed
- Permalink
- Report Inappropriate Content
Hi @fourmj
Would you please summarize in a draft table the required type of calculation for each Level/Model ID?
- Mark as New
- Bookmark
- Subscribe
- Mute
- Subscribe to RSS Feed
- Permalink
- Report Inappropriate Content
Sure. Something like this?
| Division | Model ID | Sub-Division 1 | Sub-Division 2 | Desired Calculation |
| Banking | BANKC | Consumer | Sum | |
| Banking | BANKR | Retail | Consumer Deposits | Sum |
| Banking | BANKR | Retail | Mortgage Origination | Sum |
| Consulting | CONSMC | Mgmt Consulting | Average | |
| Consulting | CONSTEC | Tech Consulting | Data Engineering | Average |
| Consulting | CONSTEC | Tech Consulting | Software Development | Average |
Currently, this is occurring. Howvever, the issue is when I want to get row sub-totals and totals.
Take, for example, in my report, the Tech Consulting Subtotal. The lowest levels, Data Engineering and Software Development are each correctly being calculated as the Average of the PQ1->PQ9 revenue values. For the Crisis Q4 2020 situation, the 9Q Average of the forecast quarters is 2,112,052.78 for Data Engineering and 2,798,960.67 for Software Development, which is correct. However, the subtotal is the Average of those two values, when I want it to be the Sum. Same issue with the whole Consulting division. I want the subtotal to be the Sum of CONSMC and CONSTEC, not the Average.
Hope that sheds some more light on the situation.
Helpful resources

Microsoft Fabric Learn Together
Covering the world! 9:00-10:30 AM Sydney, 4:00-5:30 PM CET (Paris/Berlin), 7:00-8:30 PM Mexico City

Power BI Monthly Update - April 2024
Check out the April 2024 Power BI update to learn about new features.

| User | Count |
|---|---|
| 106 | |
| 94 | |
| 76 | |
| 62 | |
| 50 |
| User | Count |
|---|---|
| 147 | |
| 106 | |
| 104 | |
| 87 | |
| 61 |


