- Power BI forums
- Updates
- News & Announcements
- Get Help with Power BI
- Desktop
- Service
- Report Server
- Power Query
- Mobile Apps
- Developer
- DAX Commands and Tips
- Custom Visuals Development Discussion
- Health and Life Sciences
- Power BI Spanish forums
- Translated Spanish Desktop
- Power Platform Integration - Better Together!
- Power Platform Integrations (Read-only)
- Power Platform and Dynamics 365 Integrations (Read-only)
- Training and Consulting
- Instructor Led Training
- Dashboard in a Day for Women, by Women
- Galleries
- Community Connections & How-To Videos
- COVID-19 Data Stories Gallery
- Themes Gallery
- Data Stories Gallery
- R Script Showcase
- Webinars and Video Gallery
- Quick Measures Gallery
- 2021 MSBizAppsSummit Gallery
- 2020 MSBizAppsSummit Gallery
- 2019 MSBizAppsSummit Gallery
- Events
- Ideas
- Custom Visuals Ideas
- Issues
- Issues
- Events
- Upcoming Events
- Community Blog
- Power BI Community Blog
- Custom Visuals Community Blog
- Community Support
- Community Accounts & Registration
- Using the Community
- Community Feedback
Register now to learn Fabric in free live sessions led by the best Microsoft experts. From Apr 16 to May 9, in English and Spanish.
- Power BI forums
- Forums
- Get Help with Power BI
- Desktop
- Conditional Formatting in a Matrix with Multiple L...
- Subscribe to RSS Feed
- Mark Topic as New
- Mark Topic as Read
- Float this Topic for Current User
- Bookmark
- Subscribe
- Printer Friendly Page
- Mark as New
- Bookmark
- Subscribe
- Mute
- Subscribe to RSS Feed
- Permalink
- Report Inappropriate Content
Conditional Formatting in a Matrix with Multiple Levels
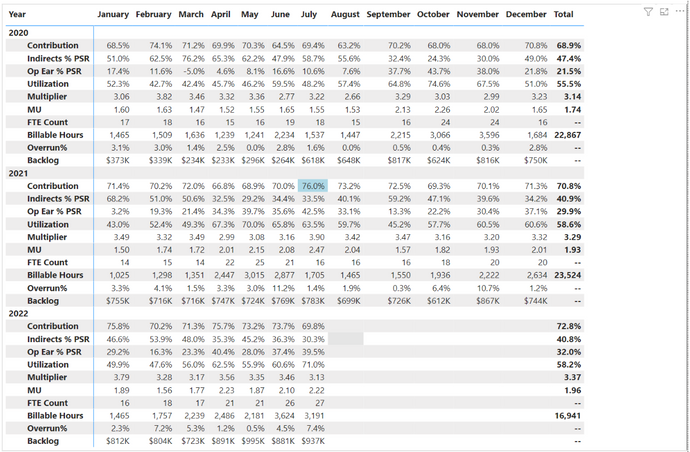
Do you happen to know how to use conditional formatting to highlight the highest monthly value? See below:
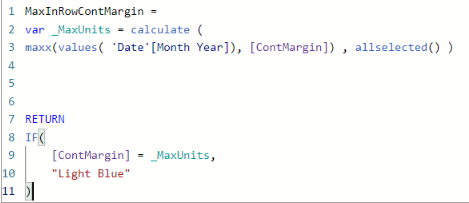
I tried the DAX measure below:
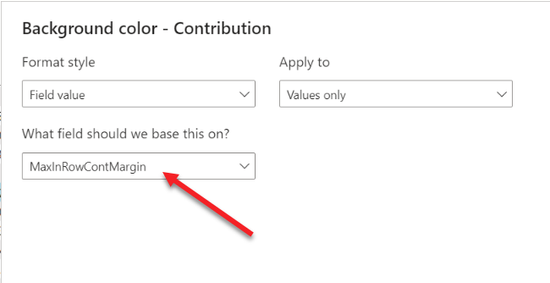
Then, going to conditional formatting and using the following:
I modified the DAX to use just Year and it works, but the challenge is when I put Month and Year on the same matrix.
Do you have any ideas or thoughts?
Thanks in advance for taking a look at it. I appreciate your time and effort.
Cheers,
Willer
Solved! Go to Solution.
- Mark as New
- Bookmark
- Subscribe
- Mute
- Subscribe to RSS Feed
- Permalink
- Report Inappropriate Content
Does the below work for you? I think the piece you are missing is that you do want to still filter by years, which you can accomplish by adding VALUES( Date[Year] ) as a filter argument of CALCULATE. The ALLSELECTED was making it so all filters from Date were getting removed. E.g.
MaxInRowContMargin =
VAR __MaxUnits =
CALCULATE(
    MAXX( SUMMARIZE( 'Date', 'Date'[Year], 'Date'[Month] ), [ContMargin] ),
    REMOVEFILTERS( 'Date' ), VALUES( 'Date'[Year] )
)
RETURN
IF(
    [ContMargin] = __MaxUnits,
    "Light Blue"
)
Note that I summarized Date by Year and Month columns, but I believe the above should work with your VALUES( [Month Year] ) instead of a summarize, too.
- Mark as New
- Bookmark
- Subscribe
- Mute
- Subscribe to RSS Feed
- Permalink
- Report Inappropriate Content
@whenriques , Change _MaxUnits like
var _MaxUnits = calculate (
maxx(values( Date[Month Year]), [ContMargin]) , allselected() )
or
var _MaxUnits = calculate (
maxx(values( Date[Month Year]), [ContMargin]) , allselected( Date[Year]) )
Microsoft Power BI Learning Resources, 2023 !!
Learn Power BI - Full Course with Dec-2022, with Window, Index, Offset, 100+ Topics !!
Did I answer your question? Mark my post as a solution! Appreciate your Kudos !! Proud to be a Super User! !!
- Mark as New
- Bookmark
- Subscribe
- Mute
- Subscribe to RSS Feed
- Permalink
- Report Inappropriate Content
Also, I wanted to mention that the matrix has the values switch to rows under Format visual. Is that what might be causing the problem? See below:
Thanks again for your help!
- Mark as New
- Bookmark
- Subscribe
- Mute
- Subscribe to RSS Feed
- Permalink
- Report Inappropriate Content
Thank you so much for your response @amitchandak . By using the recommended DAX, It highlighted the highest value of all years and months.
Currently, I have 'Date'[Year] as rows and 'Date'[Month Name] as columns. The goal is to highlight the highest 'Date'[Month Name] of every year. Seems that we are so close... Do you have any thoughts or suggestions?
I appreciate your time and effort!
Regards,
Willer
- Mark as New
- Bookmark
- Subscribe
- Mute
- Subscribe to RSS Feed
- Permalink
- Report Inappropriate Content
Does the below work for you? I think the piece you are missing is that you do want to still filter by years, which you can accomplish by adding VALUES( Date[Year] ) as a filter argument of CALCULATE. The ALLSELECTED was making it so all filters from Date were getting removed. E.g.
MaxInRowContMargin =
VAR __MaxUnits =
CALCULATE(
    MAXX( SUMMARIZE( 'Date', 'Date'[Year], 'Date'[Month] ), [ContMargin] ),
    REMOVEFILTERS( 'Date' ), VALUES( 'Date'[Year] )
)
RETURN
IF(
    [ContMargin] = __MaxUnits,
    "Light Blue"
)
Note that I summarized Date by Year and Month columns, but I believe the above should work with your VALUES( [Month Year] ) instead of a summarize, too.
- Mark as New
- Bookmark
- Subscribe
- Mute
- Subscribe to RSS Feed
- Permalink
- Report Inappropriate Content
That worked like a charm! Thank you so much for your help. Your support is very appreciated!!!
Helpful resources

Microsoft Fabric Learn Together
Covering the world! 9:00-10:30 AM Sydney, 4:00-5:30 PM CET (Paris/Berlin), 7:00-8:30 PM Mexico City

Power BI Monthly Update - April 2024
Check out the April 2024 Power BI update to learn about new features.

| User | Count |
|---|---|
| 114 | |
| 99 | |
| 83 | |
| 70 | |
| 60 |
| User | Count |
|---|---|
| 149 | |
| 114 | |
| 107 | |
| 89 | |
| 67 |


