- Power BI forums
- Updates
- News & Announcements
- Get Help with Power BI
- Desktop
- Service
- Report Server
- Power Query
- Mobile Apps
- Developer
- DAX Commands and Tips
- Custom Visuals Development Discussion
- Health and Life Sciences
- Power BI Spanish forums
- Translated Spanish Desktop
- Power Platform Integration - Better Together!
- Power Platform Integrations (Read-only)
- Power Platform and Dynamics 365 Integrations (Read-only)
- Training and Consulting
- Instructor Led Training
- Dashboard in a Day for Women, by Women
- Galleries
- Community Connections & How-To Videos
- COVID-19 Data Stories Gallery
- Themes Gallery
- Data Stories Gallery
- R Script Showcase
- Webinars and Video Gallery
- Quick Measures Gallery
- 2021 MSBizAppsSummit Gallery
- 2020 MSBizAppsSummit Gallery
- 2019 MSBizAppsSummit Gallery
- Events
- Ideas
- Custom Visuals Ideas
- Issues
- Issues
- Events
- Upcoming Events
- Community Blog
- Power BI Community Blog
- Custom Visuals Community Blog
- Community Support
- Community Accounts & Registration
- Using the Community
- Community Feedback
Register now to learn Fabric in free live sessions led by the best Microsoft experts. From Apr 16 to May 9, in English and Spanish.
- Power BI forums
- Forums
- Get Help with Power BI
- Desktop
- Computing rollup weighted sum
- Subscribe to RSS Feed
- Mark Topic as New
- Mark Topic as Read
- Float this Topic for Current User
- Bookmark
- Subscribe
- Printer Friendly Page
- Mark as New
- Bookmark
- Subscribe
- Mute
- Subscribe to RSS Feed
- Permalink
- Report Inappropriate Content
Computing rollup weighted sum
Seeking assistance from Power BI experts.
I'm trying to compute the overall progress of Program 1, which is sum of each individual Project Progress, based on the weightage assigned for each Project.
Below is the illustration. Appreciate if someone can share the expression to achieve this computation. Thanks in advanced.
| Program | Project | Weightage | Progress | Project Weighted Progress (Weightage x Progress) |
| Program 1 | Project A | 8.80% | 4.80% | 0.42% |
| Program 1 | Project B | 28.20% | 1.32% | 0.37% |
| Program 1 | Project C | 52.00% | 0.06% | 0.03% |
| Program 1 | Project D | 11.00% | 1.00% | 0.11% |
| Overall Program 1 Progress | 0.94% |
Solved! Go to Solution.
- Mark as New
- Bookmark
- Subscribe
- Mute
- Subscribe to RSS Feed
- Permalink
- Report Inappropriate Content
So based on your new requirement to apply the weightings differently at different levels you might be able to do something like the following which just dynamically changes the factor inside the SUMX based on which columns are filtered
SUMX( table1, IF(ISFILTERED( table1[Project]), 1, -- at the project level multiply by 1
IF( ISFILTERED(Program], [Project Weightage], -- at the program level apply the project weight
[Program Weightage] * [Project Weightage]) -- at the total level apply program and project weighting
* [Progress])
- Mark as New
- Bookmark
- Subscribe
- Mute
- Subscribe to RSS Feed
- Permalink
- Report Inappropriate Content
you should be able to do this with a measure like the following:
SUMX( <table name>, [Weightage] * [Progress])
- Mark as New
- Bookmark
- Subscribe
- Mute
- Subscribe to RSS Feed
- Permalink
- Report Inappropriate Content
Thanks Gosbell for the quick response.
However, SUMX doesn't seem to resolve the problem.
Mainly is because each level (Overall > Program > Project) has its own weightage.
| Program | Project | Weightage | Progress | Project Weighted Progress (Weightage x Progress) |
| Program 1 | Project A | 8.80% | 4.80% | 0.42% |
| Program 1 | Project B | 28.20% | 1.32% | 0.37% |
| Program 1 | Project C | 52.00% | 0.06% | 0.03% |
| Program 1 | Project D | 11.00% | 1.00% | 0.11% |
| Overall Program 1 Progress | 0.94% |
| Program | Project | Weightage | Progress | Project Weighted Progress (Weightage x Progress) |
| Program 2 | Project E | 20.00% | 2.00% | 0.400% |
| Program 2 | Project F | 20.00% | 1.00% | 0.200% |
| Program 2 | Project G | 30.00% | 3.00% | 0.900% |
| Program 2 | Project H | 30.00% | 3.00% | 0.900% |
| Overall Program 2 Progress | 2.40% |
| Program | Program Weightage | Program Weighted Progress (Overall Program Progress x Program Weightage) |
| Program 1 Progress | 30% | 0.28% |
| Program 2 Progress | 70% | 1.68% |
| All Programs Progress | 1.96% |
This is how my fact table looks like:-
| Program | Program Weightage (%) | Project | Project Weightage (%) | Project Progress (%) |
| Program 1 | 30% | Project A | 8.80% | 4.80% |
| Program 1 | 30% | Project B | 28.20% | 1.32% |
| Program 1 | 30% | Project C | 52.00% | 0.06% |
| Program 1 | 30% | Project D | 11.00% | 1.00% |
| Program 2 | 70% | Project E | 20.00% | 2.00% |
| Program 2 | 70% | Project F | 20.00% | 1.00% |
| Program 2 | 70% | Project G | 30.00% | 3.00% |
| Program 2 | 70% | Project H | 30.00% | 3.00% |
- Mark as New
- Bookmark
- Subscribe
- Mute
- Subscribe to RSS Feed
- Permalink
- Report Inappropriate Content
However, SUMX doesn't seem to resolve the problem.
Mainly is because each level (Overall > Program > Project) has its own weightage.
So this is additional information. We can really only answer based on the information you provided.
But doesn't the same approach still work? Isn't the program just an additional weighting that you need to apply?
eg.
SUMX( <table name>, [Program Weightage] * [Project Weightage] * [Progress])
- Mark as New
- Bookmark
- Subscribe
- Mute
- Subscribe to RSS Feed
- Permalink
- Report Inappropriate Content
The computation of the Progess (%) should be dynamic based on which level is selected.
For eg:-
When selected Project A, Progress (%) = 4.8%
When selected Program 1, Progress (%)= = 0.94%
When selected Program 2, Progress (%) = 2.4%
When selected Overall Progress (Program 1 and Program 2), the Progresss (%) = 1.96%
I don't think in this case, SUMX( <table name>, [Program Weightage] * [Project Weightage] * [Progress]) works.
- Mark as New
- Bookmark
- Subscribe
- Mute
- Subscribe to RSS Feed
- Permalink
- Report Inappropriate Content
So based on your new requirement to apply the weightings differently at different levels you might be able to do something like the following which just dynamically changes the factor inside the SUMX based on which columns are filtered
SUMX( table1, IF(ISFILTERED( table1[Project]), 1, -- at the project level multiply by 1
IF( ISFILTERED(Program], [Project Weightage], -- at the program level apply the project weight
[Program Weightage] * [Project Weightage]) -- at the total level apply program and project weighting
* [Progress])
- Mark as New
- Bookmark
- Subscribe
- Mute
- Subscribe to RSS Feed
- Permalink
- Report Inappropriate Content
Hi,
I hit another roadblock, hope you can assist again.
Your DAX works perfectly fine when I display the records in a table.
When I display a chart showing the overall All Programs progress, and start to slice to only Project A and Project B, it sums up the Progress of Project A and Project B which is not correct. Because I'm at overall All Programs level, the expectation is to sum up the progress of Project A and Project B with consideration of the Project and Program weightage.
- Mark as New
- Bookmark
- Subscribe
- Mute
- Subscribe to RSS Feed
- Permalink
- Report Inappropriate Content
It should not matter if the data is visualized in a table or a chart.
But I don't really understand what your issue is - I can't understand how you can be both at the total level and slicing by a project. Can you maybe share a screenshot or something?
- Mark as New
- Bookmark
- Subscribe
- Mute
- Subscribe to RSS Feed
- Permalink
- Report Inappropriate Content
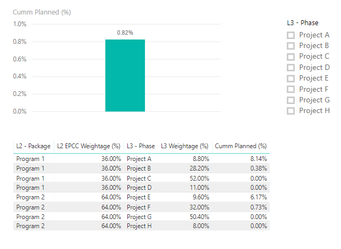
In Pic01 below, when I'm not slicing any Project, the overall progress of 0.82% at the bar chart is correct.

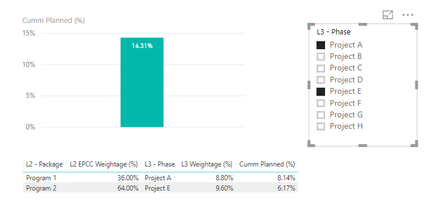
But at Pic02 below, when I slice to Project A and Project E, the Overall Progress in bar chart becomes 14.31%. The expected progress should be 0.64% [ Project A (8.14% * 8.80% * 36%) + Project E (6.17% * 9.60% * 64%)].

- Mark as New
- Bookmark
- Subscribe
- Mute
- Subscribe to RSS Feed
- Permalink
- Report Inappropriate Content
Hmm, I was just about to reply back saying that you might just have to create 3 separate measures, then I remembered that PowerBI added a new ISINSCOPE function in Nov last year.
You'll have to adjust the column names in the code below as I used the sample table you posted earlier to test this code, but I think this might work for both your tables and charts.
Cumm Planned (%) 2 = SUMX( ALL_DATA, IF(ISINSCOPE( ALL_DATA[Project]) , 1,  -- at the project level multiply by 1
    IF( ISINSCOPE(ALL_DATA[Program]) , [Project Weightage (%)] ,  -- at the program level apply the project weight
    [Program Weightage (%)] * [Project Weightage (%)]))   -- at the total level apply program and project weighting
* [Project Progress (%)])
- Mark as New
- Bookmark
- Subscribe
- Mute
- Subscribe to RSS Feed
- Permalink
- Report Inappropriate Content
Hi Gospel,
Seems like IsInscope is computing the % correctly when I filter at L3 - Phase.
When I filter at L2 - Package level, IsFiltered computation returns the correct value.
Is there a way to combine both IsFiltered and IsInScope to cater both filtering at L3 - Phase and L2 - Package as one single measure?
Thanks again.
- Mark as New
- Bookmark
- Subscribe
- Mute
- Subscribe to RSS Feed
- Permalink
- Report Inappropriate Content
@jav226 wrote:
Seems like IsInscope is computing the % correctly when I filter at L3 - Phase.
When I filter at L2 - Package level, IsFiltered computation returns the correct value.
Is there a way to combine both IsFiltered and IsInScope to cater both filtering at L3 - Phase and L2 - Package as one single measure?
Hi @jav226 - I'm seeing the same figures returned by the IsFiltered and IsInScope versions of the calc. It's hard to fix a problem I can't see. Are you able to share the details (or screenshots) of how you have your visuals configured when they return the "incorrect" results?
- Mark as New
- Bookmark
- Subscribe
- Mute
- Subscribe to RSS Feed
- Permalink
- Report Inappropriate Content
It works! Thanks again.
Helpful resources

Microsoft Fabric Learn Together
Covering the world! 9:00-10:30 AM Sydney, 4:00-5:30 PM CET (Paris/Berlin), 7:00-8:30 PM Mexico City

Power BI Monthly Update - April 2024
Check out the April 2024 Power BI update to learn about new features.

| User | Count |
|---|---|
| 110 | |
| 94 | |
| 82 | |
| 66 | |
| 58 |
| User | Count |
|---|---|
| 151 | |
| 121 | |
| 104 | |
| 87 | |
| 67 |
