- Power BI forums
- Updates
- News & Announcements
- Get Help with Power BI
- Desktop
- Service
- Report Server
- Power Query
- Mobile Apps
- Developer
- DAX Commands and Tips
- Custom Visuals Development Discussion
- Health and Life Sciences
- Power BI Spanish forums
- Translated Spanish Desktop
- Power Platform Integration - Better Together!
- Power Platform Integrations (Read-only)
- Power Platform and Dynamics 365 Integrations (Read-only)
- Training and Consulting
- Instructor Led Training
- Dashboard in a Day for Women, by Women
- Galleries
- Community Connections & How-To Videos
- COVID-19 Data Stories Gallery
- Themes Gallery
- Data Stories Gallery
- R Script Showcase
- Webinars and Video Gallery
- Quick Measures Gallery
- 2021 MSBizAppsSummit Gallery
- 2020 MSBizAppsSummit Gallery
- 2019 MSBizAppsSummit Gallery
- Events
- Ideas
- Custom Visuals Ideas
- Issues
- Issues
- Events
- Upcoming Events
- Community Blog
- Power BI Community Blog
- Custom Visuals Community Blog
- Community Support
- Community Accounts & Registration
- Using the Community
- Community Feedback
Register now to learn Fabric in free live sessions led by the best Microsoft experts. From Apr 16 to May 9, in English and Spanish.
- Power BI forums
- Forums
- Get Help with Power BI
- Desktop
- Compressing Duplicate Records
- Subscribe to RSS Feed
- Mark Topic as New
- Mark Topic as Read
- Float this Topic for Current User
- Bookmark
- Subscribe
- Printer Friendly Page
- Mark as New
- Bookmark
- Subscribe
- Mute
- Subscribe to RSS Feed
- Permalink
- Report Inappropriate Content
Compressing Duplicate Records
Hello,
Apoligies if this is a fairly trivial question, I'm quite new at Power BI.
Is there anyway to remove duplicate columns automatically without losing any data? i.e have my dataset compress all ID's of EX1 into one row instead of multiple. The ID's that I'm using may be repeated due to connections with other columns, but I'm not concerned about that, I'm looking to just get an aggregate for each day. Example:
ID - Store - Total Sales
EX1 - Store 1 - 10
EX1 - Store 2 - 10
I would like it to just be:
ID - Sales
EX1 - 20
I know this is likely easier to just format outside of Power BI, but I'm curious if it's possible to have done in Power BI.
Thanks in advance,
Solved! Go to Solution.
- Mark as New
- Bookmark
- Subscribe
- Mute
- Subscribe to RSS Feed
- Permalink
- Report Inappropriate Content
Hi Labossi,
Your data is changing everyday and you want to see the aggregation of data everyday, right?
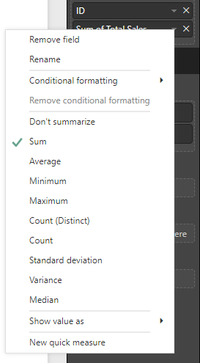
You don't need to change data in data model(e.g.:remove some columns), just drag Total Sales column and ID column into a table chart, then click Total Sales in Values pane -> select Sum

Regards,
Jimmy Tao
- Mark as New
- Bookmark
- Subscribe
- Mute
- Subscribe to RSS Feed
- Permalink
- Report Inappropriate Content
Hi Labossi,
Your data is changing everyday and you want to see the aggregation of data everyday, right?
You don't need to change data in data model(e.g.:remove some columns), just drag Total Sales column and ID column into a table chart, then click Total Sales in Values pane -> select Sum

Regards,
Jimmy Tao
- Mark as New
- Bookmark
- Subscribe
- Mute
- Subscribe to RSS Feed
- Permalink
- Report Inappropriate Content
In QueryEditor, delete the Store column, close and load.
Unless I'm not understanding your needs, this should work
Helpful resources

Microsoft Fabric Learn Together
Covering the world! 9:00-10:30 AM Sydney, 4:00-5:30 PM CET (Paris/Berlin), 7:00-8:30 PM Mexico City

Power BI Monthly Update - April 2024
Check out the April 2024 Power BI update to learn about new features.

| User | Count |
|---|---|
| 115 | |
| 100 | |
| 88 | |
| 68 | |
| 61 |
| User | Count |
|---|---|
| 150 | |
| 120 | |
| 100 | |
| 87 | |
| 68 |


