- Power BI forums
- Updates
- News & Announcements
- Get Help with Power BI
- Desktop
- Service
- Report Server
- Power Query
- Mobile Apps
- Developer
- DAX Commands and Tips
- Custom Visuals Development Discussion
- Health and Life Sciences
- Power BI Spanish forums
- Translated Spanish Desktop
- Power Platform Integration - Better Together!
- Power Platform Integrations (Read-only)
- Power Platform and Dynamics 365 Integrations (Read-only)
- Training and Consulting
- Instructor Led Training
- Dashboard in a Day for Women, by Women
- Galleries
- Community Connections & How-To Videos
- COVID-19 Data Stories Gallery
- Themes Gallery
- Data Stories Gallery
- R Script Showcase
- Webinars and Video Gallery
- Quick Measures Gallery
- 2021 MSBizAppsSummit Gallery
- 2020 MSBizAppsSummit Gallery
- 2019 MSBizAppsSummit Gallery
- Events
- Ideas
- Custom Visuals Ideas
- Issues
- Issues
- Events
- Upcoming Events
- Community Blog
- Power BI Community Blog
- Custom Visuals Community Blog
- Community Support
- Community Accounts & Registration
- Using the Community
- Community Feedback
Register now to learn Fabric in free live sessions led by the best Microsoft experts. From Apr 16 to May 9, in English and Spanish.
- Power BI forums
- Forums
- Get Help with Power BI
- Desktop
- Re: Combine two graphs with different values but s...
- Subscribe to RSS Feed
- Mark Topic as New
- Mark Topic as Read
- Float this Topic for Current User
- Bookmark
- Subscribe
- Printer Friendly Page
- Mark as New
- Bookmark
- Subscribe
- Mute
- Subscribe to RSS Feed
- Permalink
- Report Inappropriate Content
Combine two graphs with different values but similar content
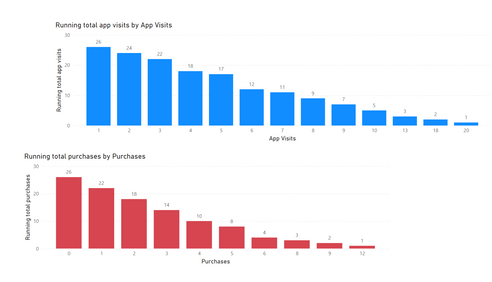
How can I combine 2 graphs into one when the values have different meaning (one is # App Views, another one is # Purchases) but on a surface have similar values: '0, 1, 2, 3, 4, 5, etc."
At the momnent I have these 2 graphs:
Here you can find the actual .pbix file: https://www.dropbox.com/s/yhua9xszvcmj2df/My%20test1.pbix?dl=0
I need to combine them into one:
Thanks in advance for your answer!
Solved! Go to Solution.
- Mark as New
- Bookmark
- Subscribe
- Mute
- Subscribe to RSS Feed
- Permalink
- Report Inappropriate Content
Hi @juliausha ,
My idea is to create two separate calculation tables, convert measure into columns in the tables, and finally present the results in a summary table:
Sheet2:
custom table:
sheet2 = VALUES(Sheet1)
measure:
sheet2AppVisits = CALCULATE(
	DISTINCTCOUNT(Sheet2[User]),
	FILTER(
		ALLSELECTED(Sheet2),
		ISONORAFTER(Sheet2[App Visits], MIN(Sheet2[App Visits]), ASC)
	)
)
new colmn:
Column = sheet2[sheet2AppVisits]
Sheet3:
sheet3 = VALUES(Sheet1)
measure:
sheet3purchases =
CALCULATE(
	DISTINCTCOUNT(Sheet3[User]),
	FILTER(
		ALLSELECTED(Sheet3),
		ISONORAFTER(Sheet3[Purchases], MIN(Sheet3[Purchases]), ASC)
	)
)
column:
Column = sheet3[sheet3purchases]
Final table:
sheetrelation = DISTINCT(UNION(DISTINCT(Sheet1[App Visits]),DISTINCT(Sheet1[Purchases])))

ColumnA = IF(LOOKUPVALUE(sheet2[Column],sheet2[App Visits],sheetrelation[App Visits])=BLANK(),0,LOOKUPVALUE(sheet2[Column],sheet2[App Visits],sheetrelation[App Visits]))

ColumnB = IF(LOOKUPVALUE(sheet3[Column],sheet3[Purchases],sheetrelation[App Visits])=BLANK(),0,LOOKUPVALUE(sheet3[Column],sheet3[Purchases],sheetrelation[App Visits]))
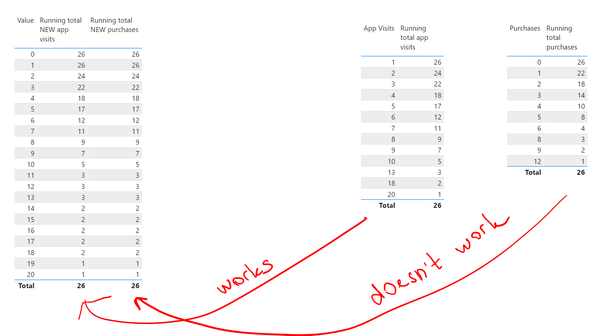
Output:
Did I answer your question? Mark my post as a solution!
Best Regards
Lucien
- Mark as New
- Bookmark
- Subscribe
- Mute
- Subscribe to RSS Feed
- Permalink
- Report Inappropriate Content
Hi @v-luwang-msft thank you very much for your solution! It's impressive how you managed to solve it. It works like charm 🙂
- Mark as New
- Bookmark
- Subscribe
- Mute
- Subscribe to RSS Feed
- Permalink
- Report Inappropriate Content
@juliausha , Assume these are column values.
You can generate a series as table
Seq = generateseries(1,200,1)
Join both these with value column of this table and use value in x-axis of visual
If both columns are from one table one join will be inactive. activate that using userelationship in a measure
Microsoft Power BI Learning Resources, 2023 !!
Learn Power BI - Full Course with Dec-2022, with Window, Index, Offset, 100+ Topics !!
Did I answer your question? Mark my post as a solution! Appreciate your Kudos !! Proud to be a Super User! !!
- Mark as New
- Bookmark
- Subscribe
- Mute
- Subscribe to RSS Feed
- Permalink
- Report Inappropriate Content
Thank you for your reply @amitchandak . I tried to follow your advise and activate a relationship by creating a new measure "USERRELATIONSHIP". Please see the .pbix file https://www.dropbox.com/s/mur7p516zm8hzo9/My%20test2.pbix?dl=0
It looks like that I did something wrong because one of my joins dosn't work properly:
Helpful resources

Microsoft Fabric Learn Together
Covering the world! 9:00-10:30 AM Sydney, 4:00-5:30 PM CET (Paris/Berlin), 7:00-8:30 PM Mexico City

Power BI Monthly Update - April 2024
Check out the April 2024 Power BI update to learn about new features.

| User | Count |
|---|---|
| 113 | |
| 97 | |
| 85 | |
| 70 | |
| 61 |
| User | Count |
|---|---|
| 151 | |
| 121 | |
| 104 | |
| 87 | |
| 67 |


