- Power BI forums
- Updates
- News & Announcements
- Get Help with Power BI
- Desktop
- Service
- Report Server
- Power Query
- Mobile Apps
- Developer
- DAX Commands and Tips
- Custom Visuals Development Discussion
- Health and Life Sciences
- Power BI Spanish forums
- Translated Spanish Desktop
- Power Platform Integration - Better Together!
- Power Platform Integrations (Read-only)
- Power Platform and Dynamics 365 Integrations (Read-only)
- Training and Consulting
- Instructor Led Training
- Dashboard in a Day for Women, by Women
- Galleries
- Community Connections & How-To Videos
- COVID-19 Data Stories Gallery
- Themes Gallery
- Data Stories Gallery
- R Script Showcase
- Webinars and Video Gallery
- Quick Measures Gallery
- 2021 MSBizAppsSummit Gallery
- 2020 MSBizAppsSummit Gallery
- 2019 MSBizAppsSummit Gallery
- Events
- Ideas
- Custom Visuals Ideas
- Issues
- Issues
- Events
- Upcoming Events
- Community Blog
- Power BI Community Blog
- Custom Visuals Community Blog
- Community Support
- Community Accounts & Registration
- Using the Community
- Community Feedback
Register now to learn Fabric in free live sessions led by the best Microsoft experts. From Apr 16 to May 9, in English and Spanish.
- Power BI forums
- Forums
- Get Help with Power BI
- Desktop
- Re: Clustered chart not splitting values correctly
- Subscribe to RSS Feed
- Mark Topic as New
- Mark Topic as Read
- Float this Topic for Current User
- Bookmark
- Subscribe
- Printer Friendly Page
- Mark as New
- Bookmark
- Subscribe
- Mute
- Subscribe to RSS Feed
- Permalink
- Report Inappropriate Content
Clustered chart not splitting values correctly
Hi all,
I'm getting this issue,
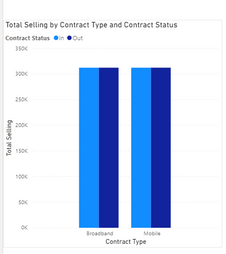
I am trying to show the value of contracts by product, split by in or out of contract. However I'm just getting the overal totals and I'd expect all four of these bars to be different sizes!
My relationships are quite complicated... but essentially;
My core data is table 1 shown far left of the image, this holds monthly charges by customer and products unique nominal code, this nominal code can be found in the directory (table 2) as there are multiple sub catagories within one nominal code, i.e. Mobile "product type in this table (table 2) has multiple rowns as there are 8 different nominal codes which would clasify as "Mobile". To create a many to single relationship this goes to a table with one column of single rows for each Product (table 3) so that this can link to table 4 (otherwise table 2 to table 4 would be many to many)
Table 4 is Contracts (each row has a contractID and each row has a Contract type (product i.e. mobile) and a colum for whether it is in or out of contract based on it's end date (simply Yes, No).
Table 5 is Documents (which is the uploaded signed peice of paper and has an association in our CRM to the "Contract" therefore table 4 and 5 are linked by "Contract ID"
Table 6 is a table of customers, so and these have an ID "SiteID"
Maybe its relationship? Maybe it's the "Seeling field"? no ideal!
- Mark as New
- Bookmark
- Subscribe
- Mute
- Subscribe to RSS Feed
- Permalink
- Report Inappropriate Content
Hi @jh292 ,
We think your table 1 and table 4 are not related.
You need to use Product Type from Product Type table instead of contract type from Contracts PwrBi table.
Or you need to change the relationship to both between table 3 and table 4.
If it doesn’t meet your requirement, could you please provide a mockup sample based on fake data?
It will be helpful if you can show us the exact expected result based on the tables.
Please upload your files to OneDrive For Business and share the link here. Please don't contain any Confidential Information or Real data in your reply.
Best regards,
Community Support Team _ zhenbw
If this post helps, then please consider Accept it as the solution to help the other members find it more quickly.
- Mark as New
- Bookmark
- Subscribe
- Mute
- Subscribe to RSS Feed
- Permalink
- Report Inappropriate Content
Hi , appoligies for the delay, I've just posted this which holds the example files and also hopefully explains the issue a little better
https://community.powerbi.com/t5/Desktop/Multiple-Tables-Relationships-costs-and-much-more/m-p/14875...
- Mark as New
- Bookmark
- Subscribe
- Mute
- Subscribe to RSS Feed
- Permalink
- Report Inappropriate Content
Hi @jh292
Can you share the pbix?
You'd need to share here the URL to the file hosted elsewhere: Dropbox, Onedrive... or just upload the file to a site like tinyupload.com (no sign-up required).
Please mark the question solved when done and consider giving a thumbs up if posts are helpful.
Contact me privately for support with any larger-scale BI needs, tutoring, etc.
Cheers
Helpful resources

Microsoft Fabric Learn Together
Covering the world! 9:00-10:30 AM Sydney, 4:00-5:30 PM CET (Paris/Berlin), 7:00-8:30 PM Mexico City

Power BI Monthly Update - April 2024
Check out the April 2024 Power BI update to learn about new features.

| User | Count |
|---|---|
| 114 | |
| 99 | |
| 82 | |
| 70 | |
| 60 |
| User | Count |
|---|---|
| 149 | |
| 114 | |
| 107 | |
| 89 | |
| 67 |


