- Power BI forums
- Updates
- News & Announcements
- Get Help with Power BI
- Desktop
- Service
- Report Server
- Power Query
- Mobile Apps
- Developer
- DAX Commands and Tips
- Custom Visuals Development Discussion
- Health and Life Sciences
- Power BI Spanish forums
- Translated Spanish Desktop
- Power Platform Integration - Better Together!
- Power Platform Integrations (Read-only)
- Power Platform and Dynamics 365 Integrations (Read-only)
- Training and Consulting
- Instructor Led Training
- Dashboard in a Day for Women, by Women
- Galleries
- Community Connections & How-To Videos
- COVID-19 Data Stories Gallery
- Themes Gallery
- Data Stories Gallery
- R Script Showcase
- Webinars and Video Gallery
- Quick Measures Gallery
- 2021 MSBizAppsSummit Gallery
- 2020 MSBizAppsSummit Gallery
- 2019 MSBizAppsSummit Gallery
- Events
- Ideas
- Custom Visuals Ideas
- Issues
- Issues
- Events
- Upcoming Events
- Community Blog
- Power BI Community Blog
- Custom Visuals Community Blog
- Community Support
- Community Accounts & Registration
- Using the Community
- Community Feedback
Register now to learn Fabric in free live sessions led by the best Microsoft experts. From Apr 16 to May 9, in English and Spanish.
- Power BI forums
- Forums
- Get Help with Power BI
- Desktop
- Checking relationships or measures between tables ...
- Subscribe to RSS Feed
- Mark Topic as New
- Mark Topic as Read
- Float this Topic for Current User
- Bookmark
- Subscribe
- Printer Friendly Page
- Mark as New
- Bookmark
- Subscribe
- Mute
- Subscribe to RSS Feed
- Permalink
- Report Inappropriate Content
Checking relationships or measures between tables due to blank visuals
Hi Everyone,
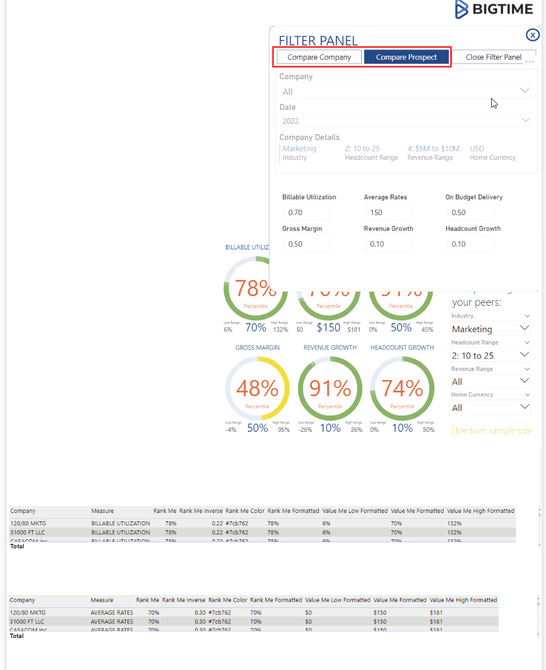
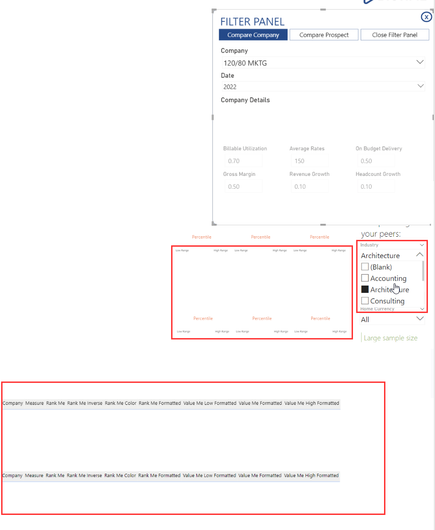
I'm stuck with a relationship or a DAX issue. I have a couple of verticles, "Compare Prospects" and "Compare Companies". I have built these as bookmarks and would like all of the visuals to work with these two bookmarks. For the ease of looking at data in the visuals I have converted the first two visuals as tables at the bottom.
Compare Companies:
In this bookmark, the user can use the "Company Slicer" and the input fields at the bottom are greyed out. For this company "120/80 MKTG" and when "Marketing" industry is selected, the visuals load properly, but when I change the industry or the company name, all the data vanishes. I need to be able to look at the data at a company and industry level. Basically I should also be able to compare with data from other industries.
Compare Prospects:
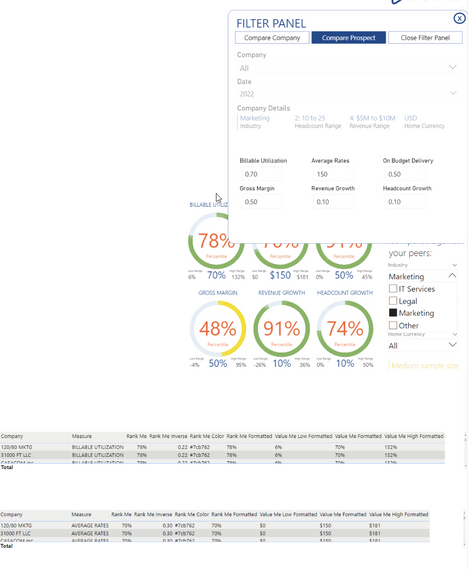
In this bookmark/scenario - the company slicer is greyed out and we have input boxes for the user to enter values into and the visuals changed based on the entered value.
The calculation works fine but when we change the industry, the visuals take time to render and breaks up a little. These visuals are built using MSFT Charticulator. This, I am assuming happens becasue it is calculating for all of the companies.
In some cases, when I switch the aggregation from "Don't summarize" to "First" the tearing is fixed but in some cases the data vanishes.
Here's the link to the sample file: https://drive.google.com/file/d/1S_n8QKAkL4C0PKM5PFchRBMDKfDVSFUs/view?usp=sharing
Ideally we would need to open up the bookmarks pane to view the issues.
Any help is appreciated.
Thanks @Ashish_Mathur !
- Mark as New
- Bookmark
- Subscribe
- Mute
- Subscribe to RSS Feed
- Permalink
- Report Inappropriate Content
Hi,
There's a maze of measures there. I just checked the Rank Me measure. Since the measure [ME Filter] returns 0 for Industry "Accounting", the measure returns blank. This should be a start for you to check the underlying logic.
Regards,
Ashish Mathur
http://www.ashishmathur.com
https://www.linkedin.com/in/excelenthusiasts/
- Mark as New
- Bookmark
- Subscribe
- Mute
- Subscribe to RSS Feed
- Permalink
- Report Inappropriate Content
Gotcha, any idea how I can change that?
- Mark as New
- Bookmark
- Subscribe
- Mute
- Subscribe to RSS Feed
- Permalink
- Report Inappropriate Content
Hi,
Please check the logic of the ME Filter measure and make the appropriate correction. Since i have not created the model, i will take a lot of time to dive into the measures there.
Regards,
Ashish Mathur
http://www.ashishmathur.com
https://www.linkedin.com/in/excelenthusiasts/
- Mark as New
- Bookmark
- Subscribe
- Mute
- Subscribe to RSS Feed
- Permalink
- Report Inappropriate Content
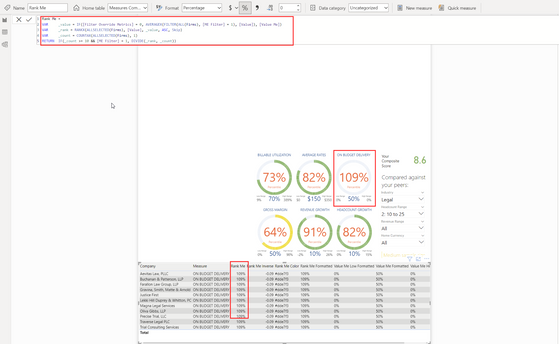
Hi @Ashish_Mathur , Quick question: I have a measure called Rank which looks like this:
- Mark as New
- Bookmark
- Subscribe
- Mute
- Subscribe to RSS Feed
- Permalink
- Report Inappropriate Content
Hi,
Share some dummy data, explain the question and show the expected result.
Regards,
Ashish Mathur
http://www.ashishmathur.com
https://www.linkedin.com/in/excelenthusiasts/
- Mark as New
- Bookmark
- Subscribe
- Mute
- Subscribe to RSS Feed
- Permalink
- Report Inappropriate Content
Sure thing @Ashish_Mathur !
So I have this "Rank Me" measure which returns 109% which I select "legal" industry. I want this measure to give me the percentile which this value belongs to, which means it should be within 0-100%. In this case its exceeding 100%. Writing a if statement to say if value exceeds 100, return 100 wouldn't be accurate since I need to calculate which percentile the value belongs to.
Here's the link to the test file with dummy data: https://drive.google.com/file/d/1S_n8QKAkL4C0PKM5PFchRBMDKfDVSFUs/view?usp=sharing
- Mark as New
- Bookmark
- Subscribe
- Mute
- Subscribe to RSS Feed
- Permalink
- Report Inappropriate Content
Hi,
Please explore the PERCENTILEX() function.
Regards,
Ashish Mathur
http://www.ashishmathur.com
https://www.linkedin.com/in/excelenthusiasts/
- Mark as New
- Bookmark
- Subscribe
- Mute
- Subscribe to RSS Feed
- Permalink
- Report Inappropriate Content
Ok. I'll look into it. Thanks!
Helpful resources

Microsoft Fabric Learn Together
Covering the world! 9:00-10:30 AM Sydney, 4:00-5:30 PM CET (Paris/Berlin), 7:00-8:30 PM Mexico City

Power BI Monthly Update - April 2024
Check out the April 2024 Power BI update to learn about new features.

| User | Count |
|---|---|
| 111 | |
| 95 | |
| 80 | |
| 68 | |
| 59 |
| User | Count |
|---|---|
| 150 | |
| 119 | |
| 104 | |
| 87 | |
| 67 |


