- Power BI forums
- Updates
- News & Announcements
- Get Help with Power BI
- Desktop
- Service
- Report Server
- Power Query
- Mobile Apps
- Developer
- DAX Commands and Tips
- Custom Visuals Development Discussion
- Health and Life Sciences
- Power BI Spanish forums
- Translated Spanish Desktop
- Power Platform Integration - Better Together!
- Power Platform Integrations (Read-only)
- Power Platform and Dynamics 365 Integrations (Read-only)
- Training and Consulting
- Instructor Led Training
- Dashboard in a Day for Women, by Women
- Galleries
- Community Connections & How-To Videos
- COVID-19 Data Stories Gallery
- Themes Gallery
- Data Stories Gallery
- R Script Showcase
- Webinars and Video Gallery
- Quick Measures Gallery
- 2021 MSBizAppsSummit Gallery
- 2020 MSBizAppsSummit Gallery
- 2019 MSBizAppsSummit Gallery
- Events
- Ideas
- Custom Visuals Ideas
- Issues
- Issues
- Events
- Upcoming Events
- Community Blog
- Power BI Community Blog
- Custom Visuals Community Blog
- Community Support
- Community Accounts & Registration
- Using the Community
- Community Feedback
Register now to learn Fabric in free live sessions led by the best Microsoft experts. From Apr 16 to May 9, in English and Spanish.
- Power BI forums
- Forums
- Get Help with Power BI
- Desktop
- Cars- how to evaluate First date seen + Price and ...
- Subscribe to RSS Feed
- Mark Topic as New
- Mark Topic as Read
- Float this Topic for Current User
- Bookmark
- Subscribe
- Printer Friendly Page
- Mark as New
- Bookmark
- Subscribe
- Mute
- Subscribe to RSS Feed
- Permalink
- Report Inappropriate Content
Cars- how to evaluate First date seen + Price and also lastest date + price
Hi,
given that table, just created for example, we need:
1) list as distinct the 'Car' collumn but, based on it's 'Date' collumn, ordering by the lastest 10 records;
2) For each 'car', we need get the first 'date' + price; also get the lastest date + price in order to draw a graph for price evolution.
Any help on best strategies to accomplish that will be appreciated.
Table
####
----
Desired results from the source table + Desired Graph
########################################
Solved! Go to Solution.
- Mark as New
- Bookmark
- Subscribe
- Mute
- Subscribe to RSS Feed
- Permalink
- Report Inappropriate Content
Hi @jr3151006 ,
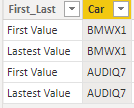
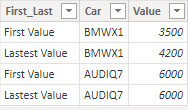
Here are the steps you can follow:
Desired results from the source table
1. Create measure.
First Value =
var _mindate=MINX(FILTER(ALL(TableCarsamdPrices),'TableCarsamdPrices'[Car]=MAX('TableCarsamdPrices'[Car])),[Date])
return
CALCULATE(SUM('TableCarsamdPrices'[Value]),FILTER(ALL(TableCarsamdPrices),'TableCarsamdPrices'[Car]=MAX('TableCarsamdPrices'[Car])&&'TableCarsamdPrices'[Date]=_mindate))
LastValue =
var
_maxdate=MAXX(FILTER(ALL(TableCarsamdPrices),'TableCarsamdPrices'[Car]=MAX('TableCarsamdPrices'[Car])),[Date])
return
CALCULATE(SUM('TableCarsamdPrices'[Value]),FILTER(ALL(TableCarsamdPrices),'TableCarsamdPrices'[Car]=MAX('TableCarsamdPrices'[Car])&&'TableCarsamdPrices'[Date]=_maxdate))2. Result:
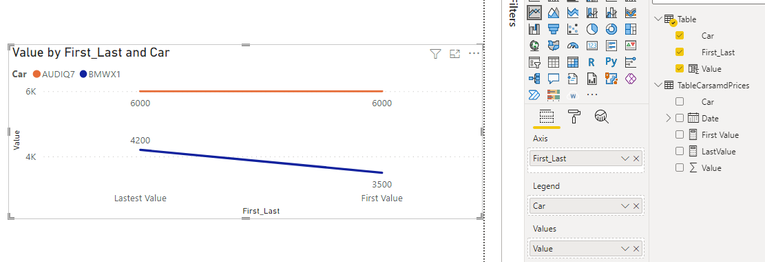
Desired Graph :
1. Using Enter data, create a table.
2. Create calculated column.
Value =
SWITCH(
    TRUE(),
    'Table'[First_Last]="First Value", CALCULATE(SUM('TableCarsamdPrices'[Value]),FILTER(ALL(TableCarsamdPrices),'TableCarsamdPrices'[Date]=
    MINX(FILTER(ALL('TableCarsamdPrices'),[Car]=EARLIER('Table'[Car])),[Date])&&'Table'[Car]=EARLIER('Table'[Car]))),
    'Table'[First_Last]="Lastest Value",  CALCULATE(SUM('TableCarsamdPrices'[Value]),FILTER(ALL(TableCarsamdPrices),'TableCarsamdPrices'[Date]=
    MaxX(FILTER(ALL('TableCarsamdPrices'),[Car]=EARLIER('Table'[Car])),[Date])&&'Table'[Car]=EARLIER('Table'[Car]))))
3.Result.
Best Regards,
Liu Yang
If this post helps, then please consider Accept it as the solution to help the other members find it more quickly
- Mark as New
- Bookmark
- Subscribe
- Mute
- Subscribe to RSS Feed
- Permalink
- Report Inappropriate Content
Hello:
For First Date and Entry questions, I'll assume the table is named table. I don't think you have a date calendar and it really would be a great idea. With this in mind,
First Date = FIRSTNONBLANK(Table[Date].[Date], SUM(Table[Value]))
First Date = FIRSTNONBLANKVALUE(Table[Date].[Date], SUM(Table[Value]))
and do the same thing for LASTNONBLANK & LASTNONBLANKVALUE.
I hope this works for you.
- Mark as New
- Bookmark
- Subscribe
- Mute
- Subscribe to RSS Feed
- Permalink
- Report Inappropriate Content
Can I use 'Power Query M' to reference the source table, group by 'car' and them discover the first value and the lastest value?
- Mark as New
- Bookmark
- Subscribe
- Mute
- Subscribe to RSS Feed
- Permalink
- Report Inappropriate Content
@jr3151006 , Try measures like
First = Calculate(firstnonblank(Table[Date],Max(Table[Value])))
Last = Calculate(lastnonblank(Table[Date],Max(Table[Value])))
or
First = Calculate(firstnonblank(Table[Date],Max(Table[Value])), allexcept(Table, Table[Car]))
Last = Calculate(lastnonblank(Table[Date],Max(Table[Value])), allexcept(Table, Table[Car]))
Microsoft Power BI Learning Resources, 2023 !!
Learn Power BI - Full Course with Dec-2022, with Window, Index, Offset, 100+ Topics !!
Did I answer your question? Mark my post as a solution! Appreciate your Kudos !! Proud to be a Super User! !!
- Mark as New
- Bookmark
- Subscribe
- Mute
- Subscribe to RSS Feed
- Permalink
- Report Inappropriate Content
Hi @amitchandak,
tks for reply, but that DAX indiscriminate the 'car' and just collect the old one and new records.
Helpful resources

Microsoft Fabric Learn Together
Covering the world! 9:00-10:30 AM Sydney, 4:00-5:30 PM CET (Paris/Berlin), 7:00-8:30 PM Mexico City

Power BI Monthly Update - April 2024
Check out the April 2024 Power BI update to learn about new features.

| User | Count |
|---|---|
| 109 | |
| 96 | |
| 77 | |
| 66 | |
| 54 |
| User | Count |
|---|---|
| 144 | |
| 104 | |
| 102 | |
| 88 | |
| 63 |


