Register now to learn Fabric in free live sessions led by the best Microsoft experts. From Apr 16 to May 9, in English and Spanish.
Grateful for any help you can give.
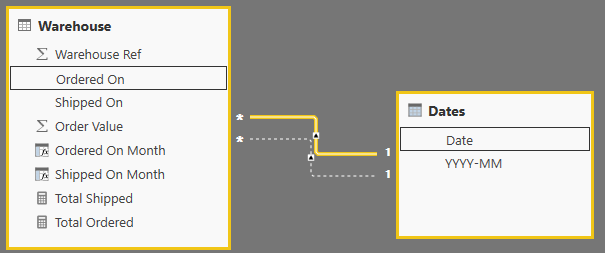
I have a table of orders here connected to a calendar table with 2 relationships, one from the Ordered On date, one from the Shipped On date:
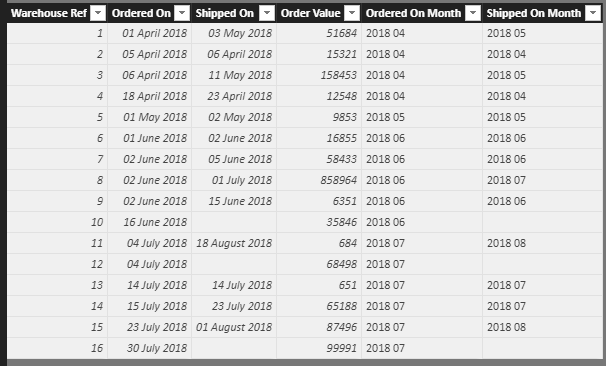
Here is what the orders look like:
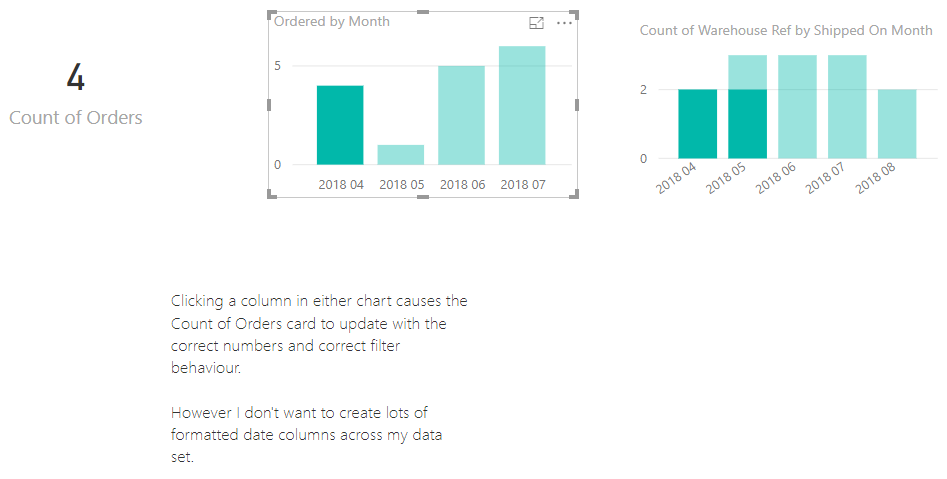
I want to make a card representing the total number of orders. For example: if I have a bar chart or orders by month, and I click a column in that bar chart, I want the card to update showing the total orders in that column. This works correctly if I use the calculated columns Ordered On Month and Shipped On Month:
But I don't want to create lots of calculated columns for all my tables across the data model. So I created a calendar table with multiple relationships and then used USERELATIONSHIP and measures which I thought would solve the issue. However, when I click on a column in the bar chart, it updates the Count of Orders card with the incorrect number, like it is still reading the month from the main relationship.
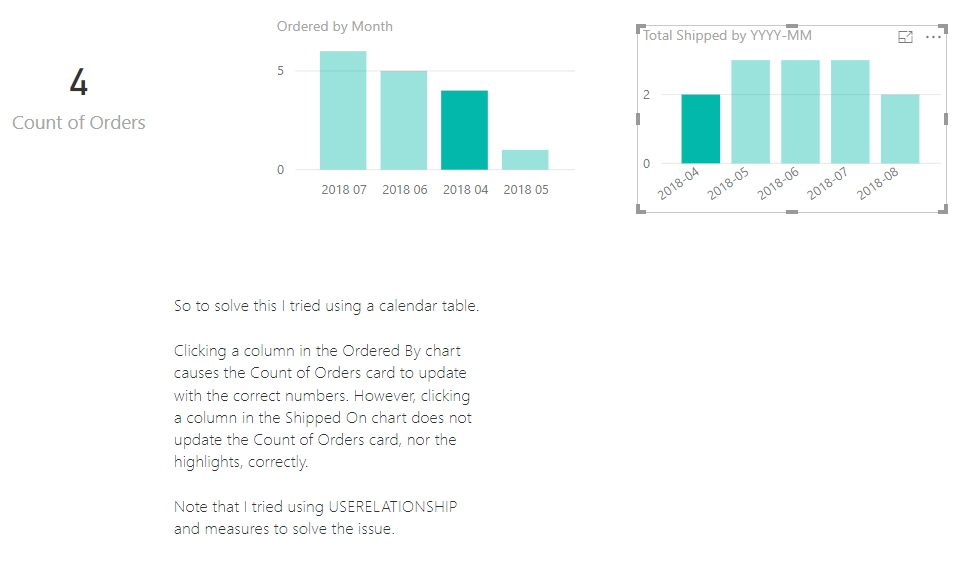
So my question is: how to create a calendar table and measures in such a way that cards update correctly with the number specified in the column clicked, not in the respective column of the active relationship.
I've linked the workbook here and happy to answer questions.
https://drive.google.com/open?id=1qJARtDN0KekQd1uSOWg5IqM71oIs9tA0
Two Cards are needed just like different measures dragged to the charts.
That's not going to work because one of your relationships is not active. But, if I understand what you are trying to accomplish, I have a couple quick measure gallery submissions that may help:
https://community.powerbi.com/t5/Quick-Measures-Gallery/Open-Tickets/m-p/409364
https://community.powerbi.com/t5/Quick-Measures-Gallery/Periodic-Billing/m-p/409365
Thanks Greg, yes that's clear.
Your links are useful because I will need to calculate the number of orders in progress per unit of time (at some point in the future). However that's not the problem I'm experiencing here. Here, I am merely concerned with 2 separate KPIs: the number of orders created, and the number of orders shipped, and the interaction between these 2 KPIs.
To put it as succinctly as possible: I want to have the behaviour of the 3rd screenshot*, without the need to create an arbitrarily large amount of calculated columns across the data model containing various formattings of dates. I want to do it in a more Effective, Idiomatic way (e.g. a calendar table).
* I define correct as: on clicking a column on either chart, the card shows the number of orders created (or shipped) in that column. The 2nd chart, showing shipped (or created) orders, is highlighted according to the orders selected in the 1st chart.
Covering the world! 9:00-10:30 AM Sydney, 4:00-5:30 PM CET (Paris/Berlin), 7:00-8:30 PM Mexico City
Check out the April 2024 Power BI update to learn about new features.
User | Count |
---|---|
110 | |
94 | |
81 | |
66 | |
58 |
User | Count |
---|---|
150 | |
119 | |
104 | |
87 | |
67 |