- Power BI forums
- Updates
- News & Announcements
- Get Help with Power BI
- Desktop
- Service
- Report Server
- Power Query
- Mobile Apps
- Developer
- DAX Commands and Tips
- Custom Visuals Development Discussion
- Health and Life Sciences
- Power BI Spanish forums
- Translated Spanish Desktop
- Power Platform Integration - Better Together!
- Power Platform Integrations (Read-only)
- Power Platform and Dynamics 365 Integrations (Read-only)
- Training and Consulting
- Instructor Led Training
- Dashboard in a Day for Women, by Women
- Galleries
- Community Connections & How-To Videos
- COVID-19 Data Stories Gallery
- Themes Gallery
- Data Stories Gallery
- R Script Showcase
- Webinars and Video Gallery
- Quick Measures Gallery
- 2021 MSBizAppsSummit Gallery
- 2020 MSBizAppsSummit Gallery
- 2019 MSBizAppsSummit Gallery
- Events
- Ideas
- Custom Visuals Ideas
- Issues
- Issues
- Events
- Upcoming Events
- Community Blog
- Power BI Community Blog
- Custom Visuals Community Blog
- Community Support
- Community Accounts & Registration
- Using the Community
- Community Feedback
Register now to learn Fabric in free live sessions led by the best Microsoft experts. From Apr 16 to May 9, in English and Spanish.
- Power BI forums
- Forums
- Get Help with Power BI
- Desktop
- Re: Calucalte weighting totals by supplier, using...
- Subscribe to RSS Feed
- Mark Topic as New
- Mark Topic as Read
- Float this Topic for Current User
- Bookmark
- Subscribe
- Printer Friendly Page
- Mark as New
- Bookmark
- Subscribe
- Mute
- Subscribe to RSS Feed
- Permalink
- Report Inappropriate Content
Calucalte weighting totals by supplier, using slicers to split by Supplier groups and divisions.
I have been going around in circles with this for some time now. I read articles regarding using Sumx, calculated columns and measures.
I have set of suppliers that work on a number of contracts where the contract maybe split 80/20 between suppliers.
I am trying to split the total value per supplier, then further by division using slicers
My aim is prodice the following table to display payments split by
- Supplier (which is a weighted calculation of Supplier Groups)
- Division
I have the following reference tables
- Payements (split by division and group name)
- Supplier Groups weighting (mapping the Supplier group, to suppliers and the weighting i.e. 80% of contract)
- Supplier Groups (naming convention for supplier groups)
- Suppliers (naming convention for supplier)
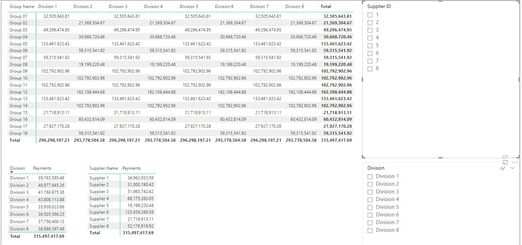
From this i created the following tables, the total is correct at £315,497,417.69 however the supplier or group of suppliers totals arent correct.
I have created 2 versions to work through.
- I have created table directly from the payments data above, however as expected it bring up the full totals.
- I have used calculated columns
Then i tried using calculated tables as follows:
Supplier spend (Group) =

SUMMARIZE('Supplier Groups Weight 1',
    'Supplier Groups Weight 1'[Group Name],
    'Suppliers'[Supplier Name],
    'Supplier Groups Weight 1'[Weight],
    "Payments", SUM('Division Total'[Payments]),
    "Total", MIN ('Supplier Groups Weight 1'[Weight]) * SUM('Division Total'[Payments])
    )
Division Total =
SUMMARIZE('Payments',Payments[Division],
Payments[Group Name],
"Payments",
SUM(Payments[Payment Amount]),
"Total", MIN ('Supplier Groups Weight 1'[Weight]) * SUM(Payments[Payment Amount])
)
I have created the following reference table within Excel to use to validate. I am unable to get the slicers to work across divisions, suppliers and supplier groups.
All source files are located here.
- Mark as New
- Bookmark
- Subscribe
- Mute
- Subscribe to RSS Feed
- Permalink
- Report Inappropriate Content
Hi @Anonymous ,
I am not sure what desired result would you want, could you please share your desired output screenshots for further analysis? Do mask sensitive data before uploading.
Best Regards,
Amy
- Mark as New
- Bookmark
- Subscribe
- Mute
- Subscribe to RSS Feed
- Permalink
- Report Inappropriate Content
Hi Amy
Thank you for the the response.
I will try and summerize / clarify my objective
Files:
- I have uploaded the anonomised data to OneDrive here
Objective:
Calculate the supplier spend, per division.
This is a calculation of a percentage of a (supplier) Group.
i.e. Supplier 1 = 100% of Group 01 and 80% of Group 16.
We would mainly focus on division 1+2, however would need visibility of spend on the other divisions.
These images would be on seperate reports
The next step would be to weight the performance of the supplier based on the percentage of spend by division. However this query is contained to only showing the supplier spend per division.
Thank you again for the help.
Helpful resources

Microsoft Fabric Learn Together
Covering the world! 9:00-10:30 AM Sydney, 4:00-5:30 PM CET (Paris/Berlin), 7:00-8:30 PM Mexico City

Power BI Monthly Update - April 2024
Check out the April 2024 Power BI update to learn about new features.

| User | Count |
|---|---|
| 110 | |
| 96 | |
| 77 | |
| 63 | |
| 55 |
| User | Count |
|---|---|
| 143 | |
| 109 | |
| 89 | |
| 84 | |
| 66 |


