- Power BI forums
- Updates
- News & Announcements
- Get Help with Power BI
- Desktop
- Service
- Report Server
- Power Query
- Mobile Apps
- Developer
- DAX Commands and Tips
- Custom Visuals Development Discussion
- Health and Life Sciences
- Power BI Spanish forums
- Translated Spanish Desktop
- Power Platform Integration - Better Together!
- Power Platform Integrations (Read-only)
- Power Platform and Dynamics 365 Integrations (Read-only)
- Training and Consulting
- Instructor Led Training
- Dashboard in a Day for Women, by Women
- Galleries
- Community Connections & How-To Videos
- COVID-19 Data Stories Gallery
- Themes Gallery
- Data Stories Gallery
- R Script Showcase
- Webinars and Video Gallery
- Quick Measures Gallery
- 2021 MSBizAppsSummit Gallery
- 2020 MSBizAppsSummit Gallery
- 2019 MSBizAppsSummit Gallery
- Events
- Ideas
- Custom Visuals Ideas
- Issues
- Issues
- Events
- Upcoming Events
- Community Blog
- Power BI Community Blog
- Custom Visuals Community Blog
- Community Support
- Community Accounts & Registration
- Using the Community
- Community Feedback
Register now to learn Fabric in free live sessions led by the best Microsoft experts. From Apr 16 to May 9, in English and Spanish.
- Power BI forums
- Forums
- Get Help with Power BI
- Desktop
- Re: Calculations from related information between ...
- Subscribe to RSS Feed
- Mark Topic as New
- Mark Topic as Read
- Float this Topic for Current User
- Bookmark
- Subscribe
- Printer Friendly Page
- Mark as New
- Bookmark
- Subscribe
- Mute
- Subscribe to RSS Feed
- Permalink
- Report Inappropriate Content
Calculations from related information between 3 tables
Hello,
I am having problems with the following issues:
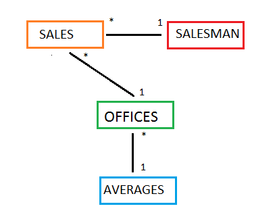
The data model is as follows (simplified):
The idea is the following:
SALESMAN contains the different Sales people.
SALES has the invoices, relating each Salesman and its Client with an OFFICE (level 1). It is monthly data.
OFFICE has the hierarchy of offices (level 2 > level 1), its description, etc.
AVERAGES has the expected sales average per level 2 office (applies to all level 1 offices in that level 2).
With that date, the way of knowing to which OFFICE reports each SALESMAN is by analyzing the month's SALES. The problem is how to reach, in a Power BI measure, from the SALESMAN to its expected AVERAGE:
The logic I have is:
SALESMAN > DISTINCT(OFFICE Lvl 1) in SALES > DISTINCT(OFFICE Lvl 2) in OFFICES > AVERAGES (per Lvl 2).
I have managed to get the average if I imput manually just one Lvl 1 OFFICE, it gets the AVERAGE as expected, using LOOKUPVALUE to get its Lvl 2, and with that the average. But when I try to do a measure that automatically gets the AVERAGE of the DISTINCT(Lvl 2) based on the DISTINCT(Lvl 1) present in SALES, it gives an error.
So, the main problem is either working with arrays of data, or doing the DISTINCT of a DISTINCT. It is done on the by-date filtered SALES, which I have, but I am not able to get this expected AVERAGE by SALESMAN.
Furthermore, if I have several SALESMAN filtered, the measure should the the AVERAGE of the AVERAGES. Any help on how could I get this, which DAX functions to use? Maybe LOOKUPVALUE is not the most suiting one.
Regards and thank you,
Antonio
Solved! Go to Solution.
- Mark as New
- Bookmark
- Subscribe
- Mute
- Subscribe to RSS Feed
- Permalink
- Report Inappropriate Content
Hi @Anonymous,
Could you try using the formula below to create a new measure to see if it works in your scenario. ![]()
Measure =
AVERAGEX (
    SALESMAN,
    CALCULATE (
        AVERAGEX ( DISTINCT ( OFFICE ), CALCULATE ( SUM ( AVERAGES[Value] ) ) )
    )
)
Note: Make sure you have set Cross Filter Direction to Both for all the relationships in your model.
Regards
Helpful resources

Microsoft Fabric Learn Together
Covering the world! 9:00-10:30 AM Sydney, 4:00-5:30 PM CET (Paris/Berlin), 7:00-8:30 PM Mexico City

Power BI Monthly Update - April 2024
Check out the April 2024 Power BI update to learn about new features.

| User | Count |
|---|---|
| 117 | |
| 107 | |
| 69 | |
| 68 | |
| 43 |
| User | Count |
|---|---|
| 148 | |
| 104 | |
| 102 | |
| 88 | |
| 66 |

