- Power BI forums
- Updates
- News & Announcements
- Get Help with Power BI
- Desktop
- Service
- Report Server
- Power Query
- Mobile Apps
- Developer
- DAX Commands and Tips
- Custom Visuals Development Discussion
- Health and Life Sciences
- Power BI Spanish forums
- Translated Spanish Desktop
- Power Platform Integration - Better Together!
- Power Platform Integrations (Read-only)
- Power Platform and Dynamics 365 Integrations (Read-only)
- Training and Consulting
- Instructor Led Training
- Dashboard in a Day for Women, by Women
- Galleries
- Community Connections & How-To Videos
- COVID-19 Data Stories Gallery
- Themes Gallery
- Data Stories Gallery
- R Script Showcase
- Webinars and Video Gallery
- Quick Measures Gallery
- 2021 MSBizAppsSummit Gallery
- 2020 MSBizAppsSummit Gallery
- 2019 MSBizAppsSummit Gallery
- Events
- Ideas
- Custom Visuals Ideas
- Issues
- Issues
- Events
- Upcoming Events
- Community Blog
- Power BI Community Blog
- Custom Visuals Community Blog
- Community Support
- Community Accounts & Registration
- Using the Community
- Community Feedback
Register now to learn Fabric in free live sessions led by the best Microsoft experts. From Apr 16 to May 9, in English and Spanish.
- Power BI forums
- Forums
- Get Help with Power BI
- Desktop
- Calculation of the sum at dimension level leads to...
- Subscribe to RSS Feed
- Mark Topic as New
- Mark Topic as Read
- Float this Topic for Current User
- Bookmark
- Subscribe
- Printer Friendly Page
- Mark as New
- Bookmark
- Subscribe
- Mute
- Subscribe to RSS Feed
- Permalink
- Report Inappropriate Content
Calculation of the sum at dimension level leads to the appearance of incorrect records in the table
Hi everyone!
I've been struggling with this problem for a few days, and I really hope for your help.
I have the following data model:
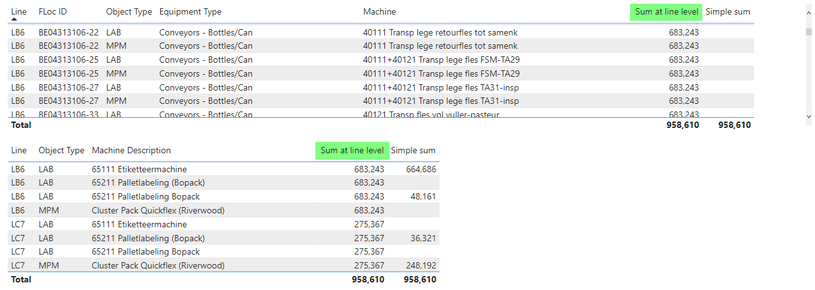
I need to show the sum of [ST] at the [Line] level in the following tables (with current selections line LB6 has the value 683,243 and line LC7 has the value 275,367, and I need to see these values in each record for corresponding [Line]):
The key difficulty here is that this sum at [Line] level:
- should be affected by selection in slicers [Line], [Object Type] and [Machine Description] (so if the user select something in these slicers, then the total sum could change);
- should NOT be affected by selection in slicers [Machine], [Equipment Type] and [FLoc ID] (the selection in these slicers don't change the sum at [Line] level).
I used the following formula:

But in reality here I should have just 4 records for which the relations in the data model are exists.
Here you could find the pbi app with data: https://drive.google.com/file/d/1mQvdpE9apnqv6NbsdyIaJdLd74KuYd7O/view?usp=sharing
Please help me to remove the incorrect records from the tables.
Many thanks in advance!
Alyona
Solved! Go to Solution.
- Mark as New
- Bookmark
- Subscribe
- Mute
- Subscribe to RSS Feed
- Permalink
- Report Inappropriate Content
In the green box you are mixing filters from the fact table (Table 1) and the dimension table (Table 2). That's a red flag. Ideally filters should only be applied at the dimension levels.
You can "fix" your visual by excluding rows where the "simple sum" measure is blank.
Helpful resources

Microsoft Fabric Learn Together
Covering the world! 9:00-10:30 AM Sydney, 4:00-5:30 PM CET (Paris/Berlin), 7:00-8:30 PM Mexico City

Power BI Monthly Update - April 2024
Check out the April 2024 Power BI update to learn about new features.

| User | Count |
|---|---|
| 111 | |
| 100 | |
| 80 | |
| 64 | |
| 58 |
| User | Count |
|---|---|
| 146 | |
| 110 | |
| 93 | |
| 84 | |
| 67 |


