- Power BI forums
- Updates
- News & Announcements
- Get Help with Power BI
- Desktop
- Service
- Report Server
- Power Query
- Mobile Apps
- Developer
- DAX Commands and Tips
- Custom Visuals Development Discussion
- Health and Life Sciences
- Power BI Spanish forums
- Translated Spanish Desktop
- Power Platform Integration - Better Together!
- Power Platform Integrations (Read-only)
- Power Platform and Dynamics 365 Integrations (Read-only)
- Training and Consulting
- Instructor Led Training
- Dashboard in a Day for Women, by Women
- Galleries
- Community Connections & How-To Videos
- COVID-19 Data Stories Gallery
- Themes Gallery
- Data Stories Gallery
- R Script Showcase
- Webinars and Video Gallery
- Quick Measures Gallery
- 2021 MSBizAppsSummit Gallery
- 2020 MSBizAppsSummit Gallery
- 2019 MSBizAppsSummit Gallery
- Events
- Ideas
- Custom Visuals Ideas
- Issues
- Issues
- Events
- Upcoming Events
- Community Blog
- Power BI Community Blog
- Custom Visuals Community Blog
- Community Support
- Community Accounts & Registration
- Using the Community
- Community Feedback
Register now to learn Fabric in free live sessions led by the best Microsoft experts. From Apr 16 to May 9, in English and Spanish.
- Power BI forums
- Forums
- Get Help with Power BI
- Desktop
- Calculated table which is change dynamically accor...
- Subscribe to RSS Feed
- Mark Topic as New
- Mark Topic as Read
- Float this Topic for Current User
- Bookmark
- Subscribe
- Printer Friendly Page
- Mark as New
- Bookmark
- Subscribe
- Mute
- Subscribe to RSS Feed
- Permalink
- Report Inappropriate Content
Calculated table which is change dynamically according to slicer selection
Hi all 🙂
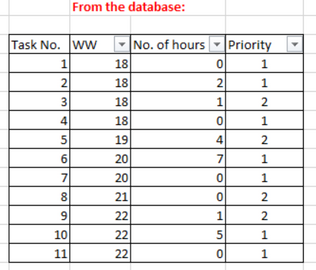
lets say i have a database table, which describe me for each task - on what WW it happened and how many hours took for it to be done. also, for each task it tells me the priority of the task - 1(top priority), 2(low priority).
now i want to creat a graph that will show me how many hours of work needed in each WW - but in a comulative way.
so if my original table i extracted from the database was something like this-
what i want is to creat a new table that will summerize for each week the effort (by hours) that was made on that week.
now i want that column (that is summerizing the effort made each week) to be calculated dynamic and change by the filter selection, so that if i will press type 1+2, i will get something like that-
but, if i perss only proprity '1' i will get something like that-
so i want both of the columns "sum of hours" & "cumulitive" to be calculated dynamic and change by the filter selection, then the graph will change as well.
thanks a lot!
Solved! Go to Solution.
- Mark as New
- Bookmark
- Subscribe
- Mute
- Subscribe to RSS Feed
- Permalink
- Report Inappropriate Content
Hey,
here you will find a little pbix file
Basically it's just necessary to calculate the cumulative of value of the working hours, due to the nature of Power BI and how the filtering works one does not need to create a sum for "basic" working hours.
But to achieve the "stepped" visual if just priority 1 is selected, it's necessary to create an additional table, that contains all the unique values from the WW column. In my example I named this table just "WW". There is a relationship between both tables on the one side the new "WW" table and on the many side the table that contains the data. This is a recommended approach and becomes much more important if your data will contain data / datetime columns.
Be aware that all the visuals are using the WW column from the WW table.
Here is a screenshot from showing the line chart with just Priority 1 filtered:
Here is the DAX statement that I use to calculate the measure that shows the cumulated Working Hours:
**bleep** No. of hours =
CALCULATE(
    SUM('Table1'[No. of hours])
    ,FILTER(
        ALL('WW'[WW])
        ,'WW'[WW] <= MAX('WW'[WW])
    )
)
Hopefully this is what you are looking for.
Regards
Tom
Did I answer your question? Mark my post as a solution, this will help others!
Proud to be a Super User!
I accept Kudos 😉
Hamburg, Germany
- Mark as New
- Bookmark
- Subscribe
- Mute
- Subscribe to RSS Feed
- Permalink
- Report Inappropriate Content
Thank you so much! very helpful! 🙂
just one more question, i did the same as you did and now i have the same table as you created on the page you shared with me.
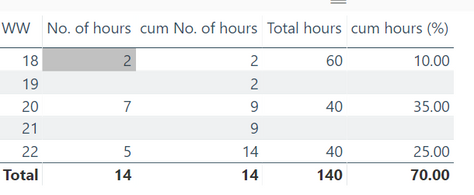
i need to calculate the cumulative column in % - so i need to divide each row (in the cumulative column) with the total of hours .
how can i sum up the "No. of hours" column ?
i tried to do it on the example you build for me, but it didn't work out! 😕
this is what i got-
and this is how i created "Total hours":
Total hours = SUM(Table1[No. of hours])
and this is how i created "**bleep** hours (%)":
**bleep** hours (%) = (Table1[**bleep** No. of hours]/Table1[Total hours])*100
why is it giving me wrong numbers? what i expected to get is-
Thanks again!! i really appriciate you time and help 🙂
- Mark as New
- Bookmark
- Subscribe
- Mute
- Subscribe to RSS Feed
- Permalink
- Report Inappropriate Content
ok, so i understand why it sums it up like that, but now i wonder how can i create a column that will sum up the No. of hours according to the priority i choose?
example- filtering to "P1" will give me sum of 14 and not 20 (=it's still sum up P1+P2), as it does no
Helpful resources

Microsoft Fabric Learn Together
Covering the world! 9:00-10:30 AM Sydney, 4:00-5:30 PM CET (Paris/Berlin), 7:00-8:30 PM Mexico City

Power BI Monthly Update - April 2024
Check out the April 2024 Power BI update to learn about new features.

| User | Count |
|---|---|
| 117 | |
| 105 | |
| 69 | |
| 67 | |
| 43 |
| User | Count |
|---|---|
| 148 | |
| 103 | |
| 103 | |
| 88 | |
| 66 |


