- Power BI forums
- Updates
- News & Announcements
- Get Help with Power BI
- Desktop
- Service
- Report Server
- Power Query
- Mobile Apps
- Developer
- DAX Commands and Tips
- Custom Visuals Development Discussion
- Health and Life Sciences
- Power BI Spanish forums
- Translated Spanish Desktop
- Power Platform Integration - Better Together!
- Power Platform Integrations (Read-only)
- Power Platform and Dynamics 365 Integrations (Read-only)
- Training and Consulting
- Instructor Led Training
- Dashboard in a Day for Women, by Women
- Galleries
- Community Connections & How-To Videos
- COVID-19 Data Stories Gallery
- Themes Gallery
- Data Stories Gallery
- R Script Showcase
- Webinars and Video Gallery
- Quick Measures Gallery
- 2021 MSBizAppsSummit Gallery
- 2020 MSBizAppsSummit Gallery
- 2019 MSBizAppsSummit Gallery
- Events
- Ideas
- Custom Visuals Ideas
- Issues
- Issues
- Events
- Upcoming Events
- Community Blog
- Power BI Community Blog
- Custom Visuals Community Blog
- Community Support
- Community Accounts & Registration
- Using the Community
- Community Feedback
Register now to learn Fabric in free live sessions led by the best Microsoft experts. From Apr 16 to May 9, in English and Spanish.
- Power BI forums
- Forums
- Get Help with Power BI
- Desktop
- Re: Calculated measure impacting Waterfall Chart
- Subscribe to RSS Feed
- Mark Topic as New
- Mark Topic as Read
- Float this Topic for Current User
- Bookmark
- Subscribe
- Printer Friendly Page
- Mark as New
- Bookmark
- Subscribe
- Mute
- Subscribe to RSS Feed
- Permalink
- Report Inappropriate Content
Calculated measure impacting Waterfall Chart
Good afternoon,
I have been trying with my colleague to solve this seemingly simple problem for the last two days and it is absolutely driving us crazy.
The problem:
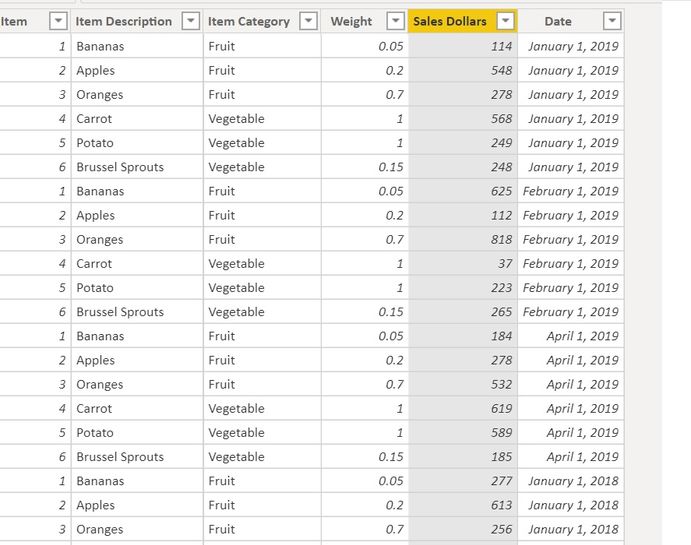
I am trying to create a Watefall chart which shows the difference between Total Sales by KG for Year over Year by Item Category. I have included links and screenshots below.
I'm trying to show how much of an impact Fruit/KG and Vegetables/KG is having on Total Sales KG. In the screenshot below I show that the gap between 2018 and 2019 is 242 (938-696). I'd like the breakdown to show how much of that difference is due to Fruits and how much is due to Vegetables.
Instead, because Total Sales KG is a calculated measure:
Sales Per Kilogram = DIVIDE(SUM(Sheet1[Sales Dollars]),SUM(Sheet1[Weight]))
The waterfall is showing Fruit Year over Year difference and Vegetables Year over Year difference without weighting it on the impact on total.
Links to the report:
Thank you if anyone is able to help us!
Regards,
Gareth.
Solved! Go to Solution.
- Mark as New
- Bookmark
- Subscribe
- Mute
- Subscribe to RSS Feed
- Permalink
- Report Inappropriate Content
Hi @jazking123 ,
After my testing, you could edit your measure like the following DAX:
Sales Per Kilogram =
CALCULATE (
    DIVIDE (
        CALCULATE (
            SUM ( Sheet1[Sales Dollars] ),
            ALLSELECTED ( Sheet1[Item Description] )
        ),
        CALCULATE ( SUM ( Sheet1[Weight] ), ALLSELECTED ( Sheet1[Item Category] ) )
    )
)
Here is the result.
If this post helps, then please consider Accept it as the solution to help the other members find it.
- Mark as New
- Bookmark
- Subscribe
- Mute
- Subscribe to RSS Feed
- Permalink
- Report Inappropriate Content
Good afternoon,
I have been trying with my colleague to solve this seemingly simple problem for the last two days and it is absolutely driving us crazy.
The problem:
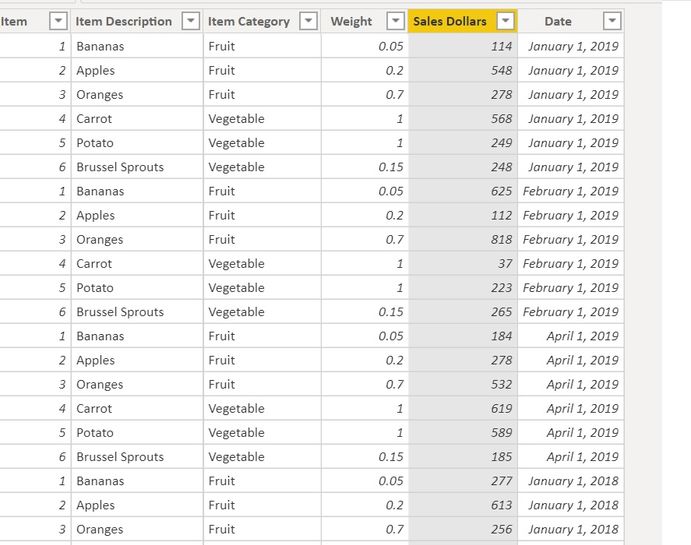
I am trying to create a Watefall chart which shows the difference between Total Sales by KG for Year over Year by Item Category. I have included links and screenshots below.
I'm trying to show how much of an impact Fruit/KG and Vegetables/KG is having on Total Sales KG. In the screenshot below I show that the gap between 2018 and 2019 is 242 (938-696). I'd like the breakdown to show how much of that difference is due to Fruits and how much is due to Vegetables.
Instead, because Total Sales KG is a calculated measure:
Sales Per Kilogram = DIVIDE(SUM(Sheet1[Sales Dollars]),SUM(Sheet1[Weight]))
The waterfall is showing Fruit Year over Year difference and Vegetables Year over Year difference without weighting it on the impact on total.
Links to the report:
Thank you if anyone is able to help us!
Regards,
Gareth.
- Mark as New
- Bookmark
- Subscribe
- Mute
- Subscribe to RSS Feed
- Permalink
- Report Inappropriate Content
Hi @jazking123 ,
After my testing, you could edit your measure like the following DAX:
Sales Per Kilogram =
CALCULATE (
    DIVIDE (
        CALCULATE (
            SUM ( Sheet1[Sales Dollars] ),
            ALLSELECTED ( Sheet1[Item Description] )
        ),
        CALCULATE ( SUM ( Sheet1[Weight] ), ALLSELECTED ( Sheet1[Item Category] ) )
    )
)
Here is the result.
If this post helps, then please consider Accept it as the solution to help the other members find it.
- Mark as New
- Bookmark
- Subscribe
- Mute
- Subscribe to RSS Feed
- Permalink
- Report Inappropriate Content
@v-eachen-msft Thank you very much for your help, it works perfectly. Quick question, I've now set up my sheet so that Sales Dollars and Weight are now attributes in the same column rather than seperate columns. I thought I could use the following filters, but it doesn't seem compatible with ALLEXCEPT.
Sales Per KG =
VAR FilteredSales =
FILTER (
'Sheet1', [Attribute] = "Sales Dollars"
)
VAR FilteredWeight =
FILTER (
'Sheet1', [Attribute] = "Weight"
)
RETURN
CALCULATE (
DIVIDE (
CALCULATE (
SUM ( 'Sheet1'[Value] ),
ALLSELECTED ( Sheet1[Attribute]),FilteredSales
),
CALCULATE (
SUM ( 'Sheet1'[Value] ),
ALLSELECTED ( Sheet1[Item Category] ),
FilteredWeight
)
)
)
I hate to ask again, but I've spent all day trying to figure this out. Do you happen to know how I should approach this?
- Mark as New
- Bookmark
- Subscribe
- Mute
- Subscribe to RSS Feed
- Permalink
- Report Inappropriate Content
Thank you so much!
The solution works well. You have saved our sanity.
Helpful resources

Microsoft Fabric Learn Together
Covering the world! 9:00-10:30 AM Sydney, 4:00-5:30 PM CET (Paris/Berlin), 7:00-8:30 PM Mexico City

Power BI Monthly Update - April 2024
Check out the April 2024 Power BI update to learn about new features.

| User | Count |
|---|---|
| 109 | |
| 98 | |
| 77 | |
| 66 | |
| 54 |
| User | Count |
|---|---|
| 144 | |
| 104 | |
| 100 | |
| 86 | |
| 64 |


