- Power BI forums
- Updates
- News & Announcements
- Get Help with Power BI
- Desktop
- Service
- Report Server
- Power Query
- Mobile Apps
- Developer
- DAX Commands and Tips
- Custom Visuals Development Discussion
- Health and Life Sciences
- Power BI Spanish forums
- Translated Spanish Desktop
- Power Platform Integration - Better Together!
- Power Platform Integrations (Read-only)
- Power Platform and Dynamics 365 Integrations (Read-only)
- Training and Consulting
- Instructor Led Training
- Dashboard in a Day for Women, by Women
- Galleries
- Community Connections & How-To Videos
- COVID-19 Data Stories Gallery
- Themes Gallery
- Data Stories Gallery
- R Script Showcase
- Webinars and Video Gallery
- Quick Measures Gallery
- 2021 MSBizAppsSummit Gallery
- 2020 MSBizAppsSummit Gallery
- 2019 MSBizAppsSummit Gallery
- Events
- Ideas
- Custom Visuals Ideas
- Issues
- Issues
- Events
- Upcoming Events
- Community Blog
- Power BI Community Blog
- Custom Visuals Community Blog
- Community Support
- Community Accounts & Registration
- Using the Community
- Community Feedback
Register now to learn Fabric in free live sessions led by the best Microsoft experts. From Apr 16 to May 9, in English and Spanish.
- Power BI forums
- Forums
- Get Help with Power BI
- Desktop
- Blank Year over Year Column
- Subscribe to RSS Feed
- Mark Topic as New
- Mark Topic as Read
- Float this Topic for Current User
- Bookmark
- Subscribe
- Printer Friendly Page
- Mark as New
- Bookmark
- Subscribe
- Mute
- Subscribe to RSS Feed
- Permalink
- Report Inappropriate Content
Blank Year over Year Column
Hello,
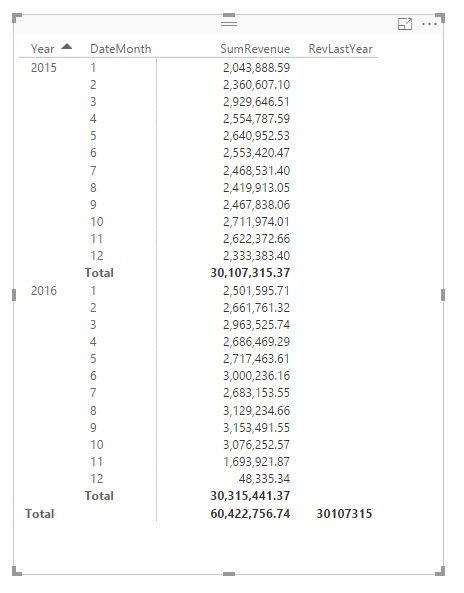
I am relatively new to Power BI so I'm still fumbling through it. I've tried to use a technique from another post, however, I continue to have an issue. As far as I can tell I have followed the steps correctly. I should be seeing 2015 results in the RevLastYear column next to 2016 as illustrated here but instead only get the Total 30107315 and that is only because I turned on Total row otherwise I have a blank RevLastYear column. I hope I provided enough information to give you an idea of what I'm up against here. Do you think you can help?
Year = YEAR(Shipments[Date])
DateMonth = MONTH(Shipments[Date])
SumRevenue = CALCULATE(SUM(Shipments[Total Revenue]))
RevLastYear = CALCULATE([SumRevenue],DATEADD(DATESYTD(Shipments[Date]),-1,YEAR))
Solved! Go to Solution.
- Mark as New
- Bookmark
- Subscribe
- Mute
- Subscribe to RSS Feed
- Permalink
- Report Inappropriate Content
Make sure your column Shipments[Date] is of type date value!
If you don't want to work with a separate date table and relate that table to your fact table you can still make it work by doing this instead:
Use Shipments[Date] directly in your visualization instead of using the calculations YEAR(..) and MONTH(...)
Power BI will create a date hierarchy for you automatically.
Change the meassure for RevLastYear to: CALCULATE([SumRevenue],DATEADD(Shipments[Date].[Date],-1,YEAR))
That should give you what you are looking for.
Br,
Magnus
- Mark as New
- Bookmark
- Subscribe
- Mute
- Subscribe to RSS Feed
- Permalink
- Report Inappropriate Content
Hi @mcornejo_1,
You can use below formula to get the previous years' total.
Pervious Year Total =
var currDate=MAX([Date])
return
SUMX(FILTER(ALL(Shipments),Shipments[Date]>=DATE(YEAR(currDate)-1,1,1)&&Shipments[Date]<=DATE(YEAR(currDate)-1,12,31)&&MONTH([Date])=MONTH(currDate)),[Total Revenue])
Pervious Year(Month/Year) =
SUMX(FILTER(ALL(Shipments),Shipments[Date]>=DATE(MAX([Year])-1,1,1)&&Shipments[Date]<=DATE(MAX([Year])-1,12,31)&&[Month]=MAX([Month])),[Total Revenue])
Result:
Regards,
Xiaoxin Sheng
If this post helps, please consider accept as solution to help other members find it more quickly.
- Mark as New
- Bookmark
- Subscribe
- Mute
- Subscribe to RSS Feed
- Permalink
- Report Inappropriate Content
Thank you all for your responses. I am able to wrap up my project now. Thiyags I did try to use SAMEPERIODLASTYEAR but I was unable to get that to work either.
- Mark as New
- Bookmark
- Subscribe
- Mute
- Subscribe to RSS Feed
- Permalink
- Report Inappropriate Content
Hi @mcornejo_1,
You can use below formula to get the previous years' total.
Pervious Year Total =
var currDate=MAX([Date])
return
SUMX(FILTER(ALL(Shipments),Shipments[Date]>=DATE(YEAR(currDate)-1,1,1)&&Shipments[Date]<=DATE(YEAR(currDate)-1,12,31)&&MONTH([Date])=MONTH(currDate)),[Total Revenue])
Pervious Year(Month/Year) =
SUMX(FILTER(ALL(Shipments),Shipments[Date]>=DATE(MAX([Year])-1,1,1)&&Shipments[Date]<=DATE(MAX([Year])-1,12,31)&&[Month]=MAX([Month])),[Total Revenue])
Result:
Regards,
Xiaoxin Sheng
If this post helps, please consider accept as solution to help other members find it more quickly.
- Mark as New
- Bookmark
- Subscribe
- Mute
- Subscribe to RSS Feed
- Permalink
- Report Inappropriate Content
Did you use SAMEPERIODLASTYEAR function?
CALCULATE(SUM(Shipments[Total Revenue]),SAMEPERIODLASTYEAR(Shipments[Date ].[Date]))
- Mark as New
- Bookmark
- Subscribe
- Mute
- Subscribe to RSS Feed
- Permalink
- Report Inappropriate Content
Make sure your column Shipments[Date] is of type date value!
If you don't want to work with a separate date table and relate that table to your fact table you can still make it work by doing this instead:
Use Shipments[Date] directly in your visualization instead of using the calculations YEAR(..) and MONTH(...)
Power BI will create a date hierarchy for you automatically.
Change the meassure for RevLastYear to: CALCULATE([SumRevenue],DATEADD(Shipments[Date].[Date],-1,YEAR))
That should give you what you are looking for.
Br,
Magnus
Helpful resources

Microsoft Fabric Learn Together
Covering the world! 9:00-10:30 AM Sydney, 4:00-5:30 PM CET (Paris/Berlin), 7:00-8:30 PM Mexico City

Power BI Monthly Update - April 2024
Check out the April 2024 Power BI update to learn about new features.

| User | Count |
|---|---|
| 114 | |
| 100 | |
| 78 | |
| 75 | |
| 50 |
| User | Count |
|---|---|
| 144 | |
| 109 | |
| 108 | |
| 88 | |
| 61 |


