- Power BI forums
- Updates
- News & Announcements
- Get Help with Power BI
- Desktop
- Service
- Report Server
- Power Query
- Mobile Apps
- Developer
- DAX Commands and Tips
- Custom Visuals Development Discussion
- Health and Life Sciences
- Power BI Spanish forums
- Translated Spanish Desktop
- Power Platform Integration - Better Together!
- Power Platform Integrations (Read-only)
- Power Platform and Dynamics 365 Integrations (Read-only)
- Training and Consulting
- Instructor Led Training
- Dashboard in a Day for Women, by Women
- Galleries
- Community Connections & How-To Videos
- COVID-19 Data Stories Gallery
- Themes Gallery
- Data Stories Gallery
- R Script Showcase
- Webinars and Video Gallery
- Quick Measures Gallery
- 2021 MSBizAppsSummit Gallery
- 2020 MSBizAppsSummit Gallery
- 2019 MSBizAppsSummit Gallery
- Events
- Ideas
- Custom Visuals Ideas
- Issues
- Issues
- Events
- Upcoming Events
- Community Blog
- Power BI Community Blog
- Custom Visuals Community Blog
- Community Support
- Community Accounts & Registration
- Using the Community
- Community Feedback
Register now to learn Fabric in free live sessions led by the best Microsoft experts. From Apr 16 to May 9, in English and Spanish.
- Power BI forums
- Forums
- Get Help with Power BI
- Desktop
- Bins based on measure
- Subscribe to RSS Feed
- Mark Topic as New
- Mark Topic as Read
- Float this Topic for Current User
- Bookmark
- Subscribe
- Printer Friendly Page
- Mark as New
- Bookmark
- Subscribe
- Mute
- Subscribe to RSS Feed
- Permalink
- Report Inappropriate Content
Bins based on measure
Hi all,
I have a table which has a column with Car registrations (for every car there is only one registration value), a date column, a slot column which has 24 values (from 0 to 23 - one for each hour within a day) and a column with a value (num of kms that a specific car has been going through for a specific date, for a specific timeslot)
for example
Registration Slot Date Distance
CarA 0 1/9/2019 12
CarB 5 1/9/2019 14
CarC 3 1/9/2019 19
CarB 22 1/9/2019 24
CarD 13 7/9/2019 12
CarD 5 9/9/2019 14
CarA 6 16/9/2019 19
CarB 11 20/9/2019 24
CarA 1 27/9/2019 8
CarC 2 27/9/2019 14
CarD 3 28/9/2019 9
CarB 23 28/9/2019 17
Date of this table is connected with date from Calendar
I want to have a stacked bar chart where x axis will be month and in stacked bar there will be the number of distinct cars which belong to a specific bins, for example for September of 2019 how many cars have going through < 5 Km , how many between 5 < and <= 10 and how many > 10 km
Consider that in data we hav records only for dates and slots that a specific car has "done" kms.
Bins will be the average of all dates, i mean sum of column Distance which will be divided by total calendar days for the given month (30 days for september). Above calculation should be done for each registration and then i should find distintcount(registration) for each bin.
Does anybody know the solution? I think i should create 3 different measures for each bin but how can i do it based on above requirements?
- Mark as New
- Bookmark
- Subscribe
- Mute
- Subscribe to RSS Feed
- Permalink
- Report Inappropriate Content
Hi @yios ,
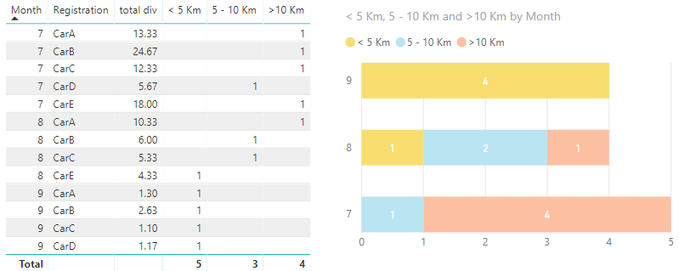
I created a sample that you can have a try.
- Calculated columns
Month = MONTH('Table'[Date])
Div =
var CountDays = CALCULATE(COUNT('Table 2'[Day]),ALLEXCEPT('Table 2','Table 2'[Month]),FILTER('Table 2','Table 2'[Month] = MAX('Table'[Month])))
return
DIVIDE('Table'[Distance],CountDays)
total div = CALCULATE(SUM('Table'[Div]),ALLEXCEPT('Table','Table'[Month],'Table'[Registration]))

Month = MONTH('Calendar'[Date])
- Measures
< 5 Km = CALCULATE(DISTINCTCOUNT('Table'[Registration]),ALLEXCEPT('Table','Table'[Month]),FILTER('Table','Table'[total div] <5 ))
>10 Km = CALCULATE(DISTINCTCOUNT('Table'[Registration]),ALLEXCEPT('Table','Table'[Month]),FILTER('Table','Table'[total div] > 10  ))
5 - 10 Km = CALCULATE(DISTINCTCOUNT('Table'[Registration]),ALLEXCEPT('Table','Table'[Month]),FILTER('Table','Table'[total div] > 5 && 'Table'[total div] <= 10 ))
I attached my sample that you can download to check if it is what you want.
Best Regards,
Xue Ding
If this post helps, then please consider Accept it as the solution to help the other members find it more quickly.
Xue Ding
If this post helps, then please consider Accept it as the solution to help the other members find it more quickly.
- Mark as New
- Bookmark
- Subscribe
- Mute
- Subscribe to RSS Feed
- Permalink
- Report Inappropriate Content
Thanks for your response but maybe i wasn't so clear.
I would like to be more dynamic!
For example user can filter the calendar and can select one calendar[date] or can drill down to a specific month in order to see the same values for each day within a month. Also user can select specific slots, this means that measure should sum the column distance only for the visible records (specific slot values and specific date)
I want to clarify it a little more.
If the visual displays measure value per days then denominator should be always one and nominator sum of distance only for visible records (only slots that have been selected)
Again, if the visual displays measure value per month then denominator should be the number of days for the specific month and nominator sum of distance only for visible records (only slots that have been selected)
Helpful resources

Microsoft Fabric Learn Together
Covering the world! 9:00-10:30 AM Sydney, 4:00-5:30 PM CET (Paris/Berlin), 7:00-8:30 PM Mexico City

Power BI Monthly Update - April 2024
Check out the April 2024 Power BI update to learn about new features.

| User | Count |
|---|---|
| 112 | |
| 100 | |
| 76 | |
| 74 | |
| 49 |
| User | Count |
|---|---|
| 146 | |
| 108 | |
| 106 | |
| 90 | |
| 62 |

