- Power BI forums
- Updates
- News & Announcements
- Get Help with Power BI
- Desktop
- Service
- Report Server
- Power Query
- Mobile Apps
- Developer
- DAX Commands and Tips
- Custom Visuals Development Discussion
- Health and Life Sciences
- Power BI Spanish forums
- Translated Spanish Desktop
- Power Platform Integration - Better Together!
- Power Platform Integrations (Read-only)
- Power Platform and Dynamics 365 Integrations (Read-only)
- Training and Consulting
- Instructor Led Training
- Dashboard in a Day for Women, by Women
- Galleries
- Community Connections & How-To Videos
- COVID-19 Data Stories Gallery
- Themes Gallery
- Data Stories Gallery
- R Script Showcase
- Webinars and Video Gallery
- Quick Measures Gallery
- 2021 MSBizAppsSummit Gallery
- 2020 MSBizAppsSummit Gallery
- 2019 MSBizAppsSummit Gallery
- Events
- Ideas
- Custom Visuals Ideas
- Issues
- Issues
- Events
- Upcoming Events
- Community Blog
- Power BI Community Blog
- Custom Visuals Community Blog
- Community Support
- Community Accounts & Registration
- Using the Community
- Community Feedback
Register now to learn Fabric in free live sessions led by the best Microsoft experts. From Apr 16 to May 9, in English and Spanish.
- Power BI forums
- Forums
- Get Help with Power BI
- Desktop
- Re: Best practice in report building with SSAS Ola...
- Subscribe to RSS Feed
- Mark Topic as New
- Mark Topic as Read
- Float this Topic for Current User
- Bookmark
- Subscribe
- Printer Friendly Page
- Mark as New
- Bookmark
- Subscribe
- Mute
- Subscribe to RSS Feed
- Permalink
- Report Inappropriate Content
Best practice in report building with SSAS Olap Cube Connection
Hello together,
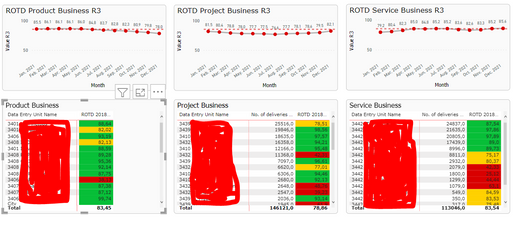
I have a general question on building dashboards from OLAP cube dataset. I consume data from a big cube connection where each KPI does not have its own datafield but is stored in "KPI". To use a specific KPI for a visual, I select the required KPI in the filter pane which is working fine if I only need one information (e.g. bar chart or line chart).
Visualising capabilities are very limited if I want to display more than one KPI. In this case I am forced to show in a Table or Matrix chart.
My question: Is there any solution or "best practice" in handling cube datasources having splitted KPI Name and Value fields? As it is SSAS Live Connection I am also not able to add Measures (which could act as workaround)
Would be very grateful for any help!
Andreas
- Mark as New
- Bookmark
- Subscribe
- Mute
- Subscribe to RSS Feed
- Permalink
- Report Inappropriate Content
Hi, @AP_BI
There are many limitations of SSAS live connection, but this is also the reason why SSAS models are highly secure.
Currently you cannot create measures in Power BI Live Connection, but you can add them in your original SSAS model.
Related tutorials:
Video_Report level measures with Power BI live connections
Video_Measures and Measure Groups on SSAS Tabular Models
Best Regards,
Community Support Team _ Eason
- Mark as New
- Bookmark
- Subscribe
- Mute
- Subscribe to RSS Feed
- Permalink
- Report Inappropriate Content
Hello @v-easonf-msft ,
thank you for your response regarding SSAS Measure creating answer. Could you respond on the first part of the question?
I am looking for best practice in handling that mentioned SSAS case if quantitative value field and KPI name are splitted fields (I described my handling into detail in my previous post)
Thank you
Andreas
Helpful resources

Microsoft Fabric Learn Together
Covering the world! 9:00-10:30 AM Sydney, 4:00-5:30 PM CET (Paris/Berlin), 7:00-8:30 PM Mexico City

Power BI Monthly Update - April 2024
Check out the April 2024 Power BI update to learn about new features.

| User | Count |
|---|---|
| 114 | |
| 99 | |
| 83 | |
| 70 | |
| 61 |
| User | Count |
|---|---|
| 149 | |
| 114 | |
| 107 | |
| 89 | |
| 67 |


