- Power BI forums
- Updates
- News & Announcements
- Get Help with Power BI
- Desktop
- Service
- Report Server
- Power Query
- Mobile Apps
- Developer
- DAX Commands and Tips
- Custom Visuals Development Discussion
- Health and Life Sciences
- Power BI Spanish forums
- Translated Spanish Desktop
- Power Platform Integration - Better Together!
- Power Platform Integrations (Read-only)
- Power Platform and Dynamics 365 Integrations (Read-only)
- Training and Consulting
- Instructor Led Training
- Dashboard in a Day for Women, by Women
- Galleries
- Community Connections & How-To Videos
- COVID-19 Data Stories Gallery
- Themes Gallery
- Data Stories Gallery
- R Script Showcase
- Webinars and Video Gallery
- Quick Measures Gallery
- 2021 MSBizAppsSummit Gallery
- 2020 MSBizAppsSummit Gallery
- 2019 MSBizAppsSummit Gallery
- Events
- Ideas
- Custom Visuals Ideas
- Issues
- Issues
- Events
- Upcoming Events
- Community Blog
- Power BI Community Blog
- Custom Visuals Community Blog
- Community Support
- Community Accounts & Registration
- Using the Community
- Community Feedback
Register now to learn Fabric in free live sessions led by the best Microsoft experts. From Apr 16 to May 9, in English and Spanish.
- Power BI forums
- Forums
- Get Help with Power BI
- Desktop
- Re: Barchart showing % sales of each month by tota...
- Subscribe to RSS Feed
- Mark Topic as New
- Mark Topic as Read
- Float this Topic for Current User
- Bookmark
- Subscribe
- Printer Friendly Page
- Mark as New
- Bookmark
- Subscribe
- Mute
- Subscribe to RSS Feed
- Permalink
- Report Inappropriate Content
Barchart showing % sales of each month by total sales for the year based on slicer selected dynamica
Hi all,
I am trying to use the bar chart to show the percentage of gross sales in each month for a product compare to the selected year, segment, country.
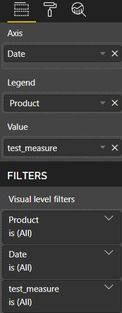
I created one measure object:
- test_measure = SUMX('Financial Sample','Financial Sample'[ Gross Sales ])
The above measure will give me the nominator value accurately when I select the relevant slicer value (Segment, Country, Product, and Date) because PBI will group the total gross sales figure (i.e. based on the selected value in the four slicers) and club the figure into the various month bucket correctly.

Probem:
As my objective is to show the % gross sales of each month which is I need to divide the Measuare object (i.e. test_measure describe above) BY the Gross Sales for the whole year (in this case 2014) and also based on other slicers selected value.
Hence, based on the above slicer selected value (i.e. Sector: Government, Country: USA, Product: Amarilla, and Year: 2014) , the test_measure should have the following DAX coding...
- Nominator = SUMX('Financial Sample','Financial Sample'[ Gross Sales ])
- Denominator = SUMX('Financial Sample','Financial Sample'[ Gross Sales ])
Obviously, the above measure will show value 1 in each month in barchart and it is wrong in spite of the DAX function in denominator will give me the correct value if I do a quick test on the number (see following last figure).
Question -
Unlike the nominator, how do I tell the POWER BI not to club the denominator value into individual month so that each of the gross sales figure in each month (nominator) will be divided by the total denominotaor value (i.e. the whole year value based on slicers value by Segment: Government, Country: USA, Product: Amarilla, and Date:2014). It seem, POWER BI, treat the denominator calculation as monthly.
I tried to use ALL function but I cannot disregard the filter criteria selected in all slicers because the denominator value has to take into consideration of all slicer value NOT only in year value.
I know this problem can be easily resolved if I, first, create a table layout to calculate the denominator value (show value as ==> percentage of grand total) and transfer the calculated table into a Barchart. However, I am just thinking from a DAX perspective to resolve it.
I know I miss out something. Hope you can shed some light. Thanks ,,tuffy

- Mark as New
- Bookmark
- Subscribe
- Mute
- Subscribe to RSS Feed
- Permalink
- Report Inappropriate Content
Hi @Anonymous,
From your description, I could not figure out which filter you want to apply in your denominator? Or you could refer to use the ALLEXCEPT function for your denominator to meet your requirements:
Reference:https://docs.microsoft.com/en-us/dax/allexcept-function-dax
I suggest you offer me a sample data to have a test and post your desired result if possible.
Regards,
Daniel He
If this post helps, then please consider Accept it as the solution to help the other members find it more quickly.
Helpful resources

Microsoft Fabric Learn Together
Covering the world! 9:00-10:30 AM Sydney, 4:00-5:30 PM CET (Paris/Berlin), 7:00-8:30 PM Mexico City

Power BI Monthly Update - April 2024
Check out the April 2024 Power BI update to learn about new features.

| User | Count |
|---|---|
| 109 | |
| 98 | |
| 80 | |
| 64 | |
| 57 |
| User | Count |
|---|---|
| 145 | |
| 110 | |
| 91 | |
| 84 | |
| 66 |

