- Power BI forums
- Updates
- News & Announcements
- Get Help with Power BI
- Desktop
- Service
- Report Server
- Power Query
- Mobile Apps
- Developer
- DAX Commands and Tips
- Custom Visuals Development Discussion
- Health and Life Sciences
- Power BI Spanish forums
- Translated Spanish Desktop
- Power Platform Integration - Better Together!
- Power Platform Integrations (Read-only)
- Power Platform and Dynamics 365 Integrations (Read-only)
- Training and Consulting
- Instructor Led Training
- Dashboard in a Day for Women, by Women
- Galleries
- Community Connections & How-To Videos
- COVID-19 Data Stories Gallery
- Themes Gallery
- Data Stories Gallery
- R Script Showcase
- Webinars and Video Gallery
- Quick Measures Gallery
- 2021 MSBizAppsSummit Gallery
- 2020 MSBizAppsSummit Gallery
- 2019 MSBizAppsSummit Gallery
- Events
- Ideas
- Custom Visuals Ideas
- Issues
- Issues
- Events
- Upcoming Events
- Community Blog
- Power BI Community Blog
- Custom Visuals Community Blog
- Community Support
- Community Accounts & Registration
- Using the Community
- Community Feedback
Register now to learn Fabric in free live sessions led by the best Microsoft experts. From Apr 16 to May 9, in English and Spanish.
- Power BI forums
- Forums
- Get Help with Power BI
- Desktop
- Re: Average headcount for a given period
- Subscribe to RSS Feed
- Mark Topic as New
- Mark Topic as Read
- Float this Topic for Current User
- Bookmark
- Subscribe
- Printer Friendly Page
- Mark as New
- Bookmark
- Subscribe
- Mute
- Subscribe to RSS Feed
- Permalink
- Report Inappropriate Content
Average headcount for a given period
Hi Everyone,
I'm new to Power BI and DAX and was hoping to get some direction on this. I did some searching but was unable to find any solutions.
The goal is to be able to calculate the average headcount over any given period (month, week, year, etc). Here is the raw data I'm starting with, it tracks changes to an employees records. As you can see, Termination date is joined across all rows for a record.
| Employment Record ID | Effective Date | Termination Date |
| a0N0Y00000AlUIP | 8/13/2018 | 8/17/2018 |
| a0N0Y00000AQMfY | 8/3/2015 | 6/30/2016 |
| a0N0Y00000AQMhr | 9/1/2016 | 5/2/2019 |
| a0N0Y00000AQMhr | 6/1/2017 | 5/2/2019 |
| a0N0Y00000AQMhr | 6/15/2017 | 5/2/2019 |
| a0N0Y00000AQMhr | 6/1/2018 | 5/2/2019 |
| a0N0Y00000AQMhz | 11/1/2016 | 6/2/2017 |
| a0N0Y00000AQMi3 | 5/15/2017 | 5/30/2019 |
| a0N0Y00000AQMi3 | 6/19/2017 | 5/30/2019 |
| a0N0Y00000AQMi3 | 6/1/2018 | 5/30/2019 |
| a0N0Y00000AQMiC | 10/23/2017 | 11/2/2018 |
| a0N0Y00000AQMiF | 12/4/2017 | |
| a0N0Y00000AQMiF | 6/1/2018 | |
| a0N0Y00000AQMyT | 8/6/2018 | |
| a0N0Y00000AQMyT | 8/24/2018 | |
| a0N0Y00000AQMyT | 3/1/2019 | |
| a0N0Y00000AQMyT | 10/1/2019 |
To help facilitate my goal, I've grouped the rows by ID, created an Index column, and used it to create an end date for each row. Here is what the data looks like now:
| Employment Record ID | Group.Effective Date | End Date |
| a0N0Y00000AlUIP | 8/13/2018 | 8/17/2018 |
| a0N0Y00000AQMfY | 8/3/2015 | 6/30/2016 |
| a0N0Y00000AQMhr | 9/1/2016 | 5/31/2017 |
| a0N0Y00000AQMhr | 6/1/2017 | 6/14/2017 |
| a0N0Y00000AQMhr | 6/15/2017 | 5/31/2018 |
| a0N0Y00000AQMhr | 6/1/2018 | 5/2/2019 |
| a0N0Y00000AQMhz | 11/1/2016 | 6/2/2017 |
| a0N0Y00000AQMi3 | 5/15/2017 | 6/18/2017 |
| a0N0Y00000AQMi3 | 6/19/2017 | 5/31/2018 |
| a0N0Y00000AQMi3 | 6/1/2018 | 5/30/2019 |
| a0N0Y00000AQMiC | 10/23/2017 | 11/2/2018 |
| a0N0Y00000AQMiF | 12/4/2017 | 5/31/2018 |
| a0N0Y00000AQMiF | 6/1/2018 | 10/20/2020 |
| a0N0Y00000AQMyT | 8/6/2018 | 8/23/2018 |
| a0N0Y00000AQMyT | 8/24/2018 | 2/28/2019 |
| a0N0Y00000AQMyT | 3/1/2019 | 9/30/2019 |
| a0N0Y00000AQMyT | 10/1/2019 | 10/20/2020 |
I've also created a date table with the neccessary periods that is dynamically limited to the date ranges I want available.
I was able to find and manipulate a suggestion that accurately gives me the total headcount in any period;
Total Headcount =
CALCULATE( COUNTROWS( DISTINCT(JobHistoryReport[Employment Record ID]) ),
    FILTER( VALUES( JobHistoryReport[Group.Effective Date] ), JobHistoryReport[Group.Effective Date] <= MAX( 'Date'[Date] ) ),
    FILTER( VALUES( JobHistoryReport[End Date] ), OR( JobHistoryReport[End Date] >=MIN( 'Date'[Date] ), ISBLANK( JobHistoryReport[End Date] ) ) ) )
However, I have been unsucessful at crafting/finding a formula that would give me the average headcount for any period (use of sumx maybe?). Here is an example of desired output;
| Employment Record ID | Group.Effective Date | End Date |
| a0N0Y00000AQMhr | 6/1/2017 | 6/14/2017 |
| a0N0Y00000AQMi3 | 5/15/2017 | 6/18/2017 |
Given just the two rows above, my average headcount for June 2017 would be;
| Period | Average Headcount |
| June 2017 | 1.07 |
14 (from row 1) + 18 (from row 2) / 30 (days in the period) = 1.07 Average Headcount.
Any help would be appreciated, thank you all!
Solved! Go to Solution.
- Mark as New
- Bookmark
- Subscribe
- Mute
- Subscribe to RSS Feed
- Permalink
- Report Inappropriate Content
Hi Paul,
I appreciate the reply!
While I have found -a- solution to this issue, I wouldn't mind a better one. 🙂 This solution is "imperfect" because it relies on creating what is potentially millions of record rows. However, it does provide accurate and easy to manage calculations.
To summerize the issue:
I have a set of data that includes these relevant fields: Start Date, End Date and ID
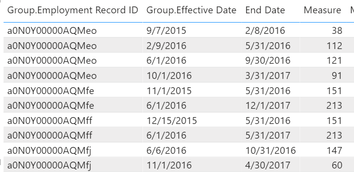
I'm attempting to count average headcount over any given period. My results might look like;
The proper way to calculate this would be the forumula below:
Sum number of days each record was active in a period / Number of days in the period
Here is an Example: Given only the below table, If I wanted to calculate the average headcount in June 2018, I would get 2.3
12+16+12+23+5 = 68
68/29 = 2.3
Where 29 is the number of days in the month of June 2018.
------------------------------
Here is my current imperfect solution:
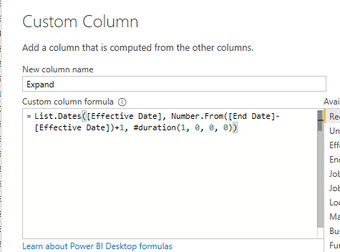
- Create unique rows for every date a record is active and expand the table.
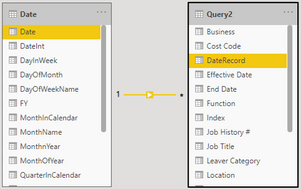
- Create an Active relationship between this table and a date table
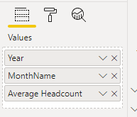
From here, it is a simple measure to create a table which calculates your average headcount:
Average Headcount = COUNTROWS(Query2) / COUNTROWS('Date')
I only ultimately worry about the number of rows this creates. I don't have a lot of experience with the platform, so I'm not sure whether its going to be able to handle a number like 10 million rows, I may have to limit my date ranges to ~2-3 years to compensate
Thanks for everyone's time. 🙂
- Mark as New
- Bookmark
- Subscribe
- Mute
- Subscribe to RSS Feed
- Permalink
- Report Inappropriate Content
@Quamie
It is difficult for us to follow your post with those information throw to us partly. Can you put those samples in a pbix, and post a question with the sample pbix file.
Regards
Paul
- Mark as New
- Bookmark
- Subscribe
- Mute
- Subscribe to RSS Feed
- Permalink
- Report Inappropriate Content
Hi Paul,
I appreciate the reply!
While I have found -a- solution to this issue, I wouldn't mind a better one. 🙂 This solution is "imperfect" because it relies on creating what is potentially millions of record rows. However, it does provide accurate and easy to manage calculations.
To summerize the issue:
I have a set of data that includes these relevant fields: Start Date, End Date and ID
I'm attempting to count average headcount over any given period. My results might look like;
The proper way to calculate this would be the forumula below:
Sum number of days each record was active in a period / Number of days in the period
Here is an Example: Given only the below table, If I wanted to calculate the average headcount in June 2018, I would get 2.3
12+16+12+23+5 = 68
68/29 = 2.3
Where 29 is the number of days in the month of June 2018.
------------------------------
Here is my current imperfect solution:
- Create unique rows for every date a record is active and expand the table.
- Create an Active relationship between this table and a date table
From here, it is a simple measure to create a table which calculates your average headcount:
Average Headcount = COUNTROWS(Query2) / COUNTROWS('Date')
I only ultimately worry about the number of rows this creates. I don't have a lot of experience with the platform, so I'm not sure whether its going to be able to handle a number like 10 million rows, I may have to limit my date ranges to ~2-3 years to compensate
Thanks for everyone's time. 🙂
- Mark as New
- Bookmark
- Subscribe
- Mute
- Subscribe to RSS Feed
- Permalink
- Report Inappropriate Content
🙂 Bump for any assistance.
I was trying out some different approaches. I was able to create an additional measure on the table itself that accurately counted the number of days in the period when a date range is selected, however the total for that measure is not correct. It may lead me to be able to calculate the average for a period when that period is selected.
Alas, that would not yield me what I'm ultimately looking for, which are tables/charts broken down by period (month, year, week, etc) with the average count.
Helpful resources

Microsoft Fabric Learn Together
Covering the world! 9:00-10:30 AM Sydney, 4:00-5:30 PM CET (Paris/Berlin), 7:00-8:30 PM Mexico City

Power BI Monthly Update - April 2024
Check out the April 2024 Power BI update to learn about new features.

| User | Count |
|---|---|
| 111 | |
| 99 | |
| 80 | |
| 64 | |
| 57 |
| User | Count |
|---|---|
| 145 | |
| 111 | |
| 92 | |
| 84 | |
| 66 |


