- Power BI forums
- Updates
- News & Announcements
- Get Help with Power BI
- Desktop
- Service
- Report Server
- Power Query
- Mobile Apps
- Developer
- DAX Commands and Tips
- Custom Visuals Development Discussion
- Health and Life Sciences
- Power BI Spanish forums
- Translated Spanish Desktop
- Power Platform Integration - Better Together!
- Power Platform Integrations (Read-only)
- Power Platform and Dynamics 365 Integrations (Read-only)
- Training and Consulting
- Instructor Led Training
- Dashboard in a Day for Women, by Women
- Galleries
- Community Connections & How-To Videos
- COVID-19 Data Stories Gallery
- Themes Gallery
- Data Stories Gallery
- R Script Showcase
- Webinars and Video Gallery
- Quick Measures Gallery
- 2021 MSBizAppsSummit Gallery
- 2020 MSBizAppsSummit Gallery
- 2019 MSBizAppsSummit Gallery
- Events
- Ideas
- Custom Visuals Ideas
- Issues
- Issues
- Events
- Upcoming Events
- Community Blog
- Power BI Community Blog
- Custom Visuals Community Blog
- Community Support
- Community Accounts & Registration
- Using the Community
- Community Feedback
Register now to learn Fabric in free live sessions led by the best Microsoft experts. From Apr 16 to May 9, in English and Spanish.
- Power BI forums
- Forums
- Get Help with Power BI
- Desktop
- Average Frequency by Hour Calculation
- Subscribe to RSS Feed
- Mark Topic as New
- Mark Topic as Read
- Float this Topic for Current User
- Bookmark
- Subscribe
- Printer Friendly Page
- Mark as New
- Bookmark
- Subscribe
- Mute
- Subscribe to RSS Feed
- Permalink
- Report Inappropriate Content
Average Frequency by Hour Calculation
Hello Everyone!
Penny for your thoughts
Fact Table
| Exam Id | Report Date | Report Hour | Employee | Location | Task Type |
| 1A | 6/1/2020 | 10:00 AM | John Doe | Office | AB |
| 1B | 6/1/2020 | 5:00 AM | Jane Doe | Home | AB |
| 1C | 6/1/2020 | 10:00 AM | Batman | Bat Cave | CD |
| 1D | 6/1/2020 | 3:00 PM | John Doe | Office | CD |
| 2A | 6/1/2020 | 5:00 PM | Jane Doe | Home | AB |
| 2B | 6/1/2020 | 7:00 AM | Batman | Bat Cave | EF |
| 2C | 6/2/2020 | 8:00 AM | John Doe | Home | AB |
| 2D | 6/2/2020 | 1:00 AM | Jane Doe | Bat Cave | AB |
| 3A | 6/2/2020 | 3:00 PM | Batman | Office | CD |
| 3B | 6/2/2020 | 4:00 PM | John Doe | Home | EF |
| 3C | 6/2/2020 | 6:00 PM | Jane Doe | Bat Cave | AB |
| 3D | 6/2/2020 | 9:00 AM | Batman | Office | CD |
| 5A | 6/3/2020 | 3:00 AM | John Doe | Bat Cave | CD |
| 4B | 6/3/2020 | 5:00 AM | Jane Doe | Office | EF |
| 5C | 6/3/2020 | 7:00 AM | Batman | Home | AB |
| 4C | 6/3/2020 | 10:00 AM | Batman | Home | AB |
| 4A | 6/3/2020 | 11:00 AM | John Doe | Bat Cave | AB |
| 5B | 6/3/2020 | 5:00 PM | Jane Doe | Office | EF |
| 6A | 6/4/2020 | 8:00 PM | John Doe | Office | CD |
| 6B | 6/4/2020 | 1:00 AM | Jane Doe | Home | EF |
| 6C | 6/4/2020 | 2:00 AM | Batman | Bat Cave | AB |
| 7A | 6/4/2020 | 4:00 AM | John Doe | Office | CD |
| 7B | 6/4/2020 | 7:00 PM | Jane Doe | Home | CD |
| 7C | 6/4/2020 | 9:00 AM | Batman | Bat Cave | US |
| 8A | 6/5/2020 | 10:00 AM | Ned Flanders | Home | US |
| 8B | 6/5/2020 | 3:00 PM | Bart Simpson | Office | AB |
| 9A | 6/6/2020 | 11:00 AM | John Doe | Home | EF |
| 9B | 6/6/2020 | 5:00 AM | Jane Doe | Bat Cave | CD |
| 9C | 6/6/2020 | 10:00 AM | Batman | Office | CD |
| 10A | 6/7/2020 | 3:00 PM | John Doe | Home | AB |
| 11A | 6/8/2020 | 12:00 PM | Jane Doe | Bat Cave | EF |
| 11B | 6/8/2020 | 1:00 PM | Batman | Office | AB |
| 11C | 6/8/2020 | 8:00 AM | John Doe | Bat Cave | CD |
| 11D | 6/8/2020 | 1:00 AM | Jane Doe | Office | AB |
| 11E | 6/8/2020 | 3:00 PM | Batman | Home | EF |
| 11F | 6/8/2020 | 4:00 PM | John Doe | Bat Cave | CD |
| 12A | 6/9/2020 | 6:00 PM | Jane Doe | Office | US |
| 12B | 6/9/2020 | 2:00 PM | Batman | Home | CD |
| 12C | 6/9/2020 | 11:00 AM | John Doe | Office | AB |
Goal: Visualize the average number of exams and task types by hour
Current Approach:
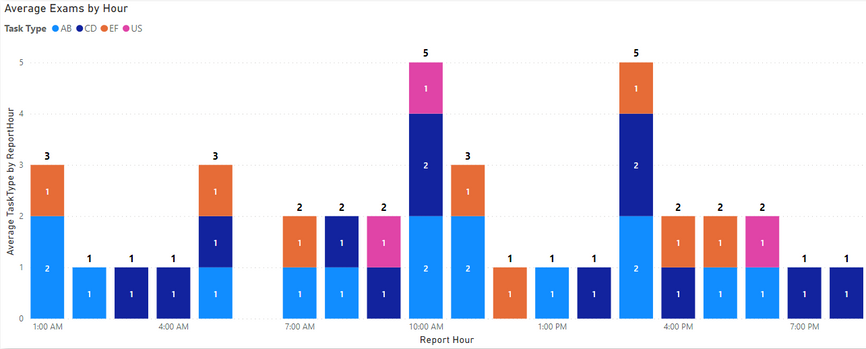
Calculate the number the of 'Task Types' filtered by 'Report Hour' and visualize that on a stacked column chart as follows
Axis: Report Hour
Legend: Report Type
Values: Average TaskType by Report Hour
DAX for Average TaskType by Report Hour
)
)
Result:
I still get a result that shows me the number of Exam Types by Hour.
Where did I go wrong? How Can I do this correctly?
Data Validation Value:
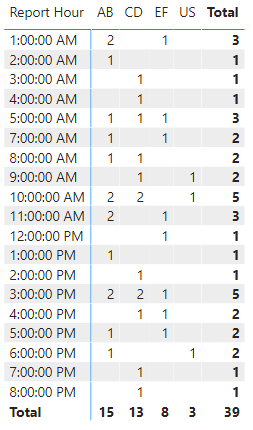
These are the exam frequencies by hour and Task Type over the 9 days covered in the data set
I want to know what the average number of exam types by hour.
So over 9 days there were 9 different 10:00 AM time windows
5 exams occured in that time window that time period
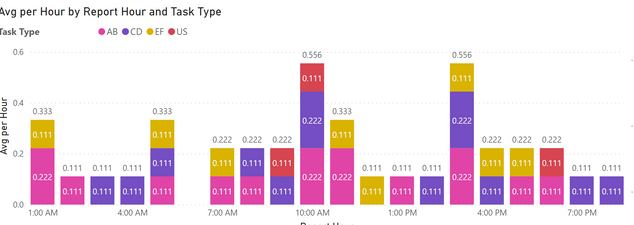
That means on average there were 0.55 exams in the 10:00 AM time window (5 exams/ 9 days)
- 0.22 of them were of type AB (2 exams/9 days)
- 0.22 of them were of type CD (2 exams/9 days)
- 0.11 of them were of type US (1 exam/9 days)
0.22 (AB) + 0.22 (CD) + 0.11 (US) = 0.55 (Total)
I would like to visualize there number for each time slot!
(EX. What does this look like for 11:00 AM, 12:00 PM, 1:00 PM, etc.)
Thank you so much for all your help!!!!
Solved! Go to Solution.
- Mark as New
- Bookmark
- Subscribe
- Mute
- Subscribe to RSS Feed
- Permalink
- Report Inappropriate Content
@mccollough here are 3 measures to get this going. these are self-explanatory but if you need further details, let me know.
Count Exams = COUNTROWS ( Exam1 )  //exam1 is a name of the table in my model

Number of Days = CALCULATE ( DISTINCTCOUNT ( Exam1[Report Date] ), ALLSELECTED () )

Avg per Hour =
VAR __examDays = Exam1[Number of Days]
RETURN
SUMX (
    SUMMARIZE (
        Exam1,
        Exam1[Report Hour],
        Exam1[Task Type],
        "@AVG",  DIVIDE ( [Count Exams], __examDays )
    ),
    [@AVG]
)
✨ Follow us on LinkedIn
Check my latest blog post The Power of Using Calculation Groups with Inactive Relationships (Part 1) (perytus.com) I would ❤ Kudos if my solution helped. 👉 If you can spend time posting the question, you can also make efforts to give Kudos to whoever helped to solve your problem. It is a token of appreciation!
⚡ Visit us at https://perytus.com, your one-stop-shop for Power BI-related projects/training/consultancy.⚡
Subscribe to the @PowerBIHowTo YT channel for an upcoming video on List and Record functions in Power Query!!
Learn Power BI and Fabric - subscribe to our YT channel - Click here: @PowerBIHowTo
If my solution proved useful, I'd be delighted to receive Kudos. When you put effort into asking a question, it's equally thoughtful to acknowledge and give Kudos to the individual who helped you solve the problem. It's a small gesture that shows appreciation and encouragement! ❤
Did I answer your question? Mark my post as a solution. Proud to be a Super User! Appreciate your Kudos 🙂
Feel free to email me with any of your BI needs.
- Mark as New
- Bookmark
- Subscribe
- Mute
- Subscribe to RSS Feed
- Permalink
- Report Inappropriate Content
Worked like a charm!
Thank you for your help!!!
- Mark as New
- Bookmark
- Subscribe
- Mute
- Subscribe to RSS Feed
- Permalink
- Report Inappropriate Content
@mccollough is this the output you are expecting:
Subscribe to the @PowerBIHowTo YT channel for an upcoming video on List and Record functions in Power Query!!
Learn Power BI and Fabric - subscribe to our YT channel - Click here: @PowerBIHowTo
If my solution proved useful, I'd be delighted to receive Kudos. When you put effort into asking a question, it's equally thoughtful to acknowledge and give Kudos to the individual who helped you solve the problem. It's a small gesture that shows appreciation and encouragement! ❤
Did I answer your question? Mark my post as a solution. Proud to be a Super User! Appreciate your Kudos 🙂
Feel free to email me with any of your BI needs.
- Mark as New
- Bookmark
- Subscribe
- Mute
- Subscribe to RSS Feed
- Permalink
- Report Inappropriate Content
@parry2k That's exactly what I was looking for! Would you mind breaking down how you accomplished that?
- Mark as New
- Bookmark
- Subscribe
- Mute
- Subscribe to RSS Feed
- Permalink
- Report Inappropriate Content
@mccollough not sure what you want the expected result to be? Can you explain?
Subscribe to the @PowerBIHowTo YT channel for an upcoming video on List and Record functions in Power Query!!
Learn Power BI and Fabric - subscribe to our YT channel - Click here: @PowerBIHowTo
If my solution proved useful, I'd be delighted to receive Kudos. When you put effort into asking a question, it's equally thoughtful to acknowledge and give Kudos to the individual who helped you solve the problem. It's a small gesture that shows appreciation and encouragement! ❤
Did I answer your question? Mark my post as a solution. Proud to be a Super User! Appreciate your Kudos 🙂
Feel free to email me with any of your BI needs.
- Mark as New
- Bookmark
- Subscribe
- Mute
- Subscribe to RSS Feed
- Permalink
- Report Inappropriate Content
@parry2k
Aha! There's part of the problem!
I was thinking about it the wrong way.
I updated the Data validation segment of my post to better reflect what I'm looking for.
Unfortunately I still don't know how to go about making DAX perform that calculation.
PS
I also modified the fact table slightly to reflect how the data actually appears in my real dataset
Helpful resources

Microsoft Fabric Learn Together
Covering the world! 9:00-10:30 AM Sydney, 4:00-5:30 PM CET (Paris/Berlin), 7:00-8:30 PM Mexico City

Power BI Monthly Update - April 2024
Check out the April 2024 Power BI update to learn about new features.

| User | Count |
|---|---|
| 112 | |
| 100 | |
| 80 | |
| 64 | |
| 57 |
| User | Count |
|---|---|
| 146 | |
| 110 | |
| 93 | |
| 84 | |
| 67 |


