I have some sample data here that is a reflection of a real-life problem I'm facing (can't use real data, sorry). Appreciate any input you can give around the data model or some DAX pointers maybe.
Please see .pbix attachment.
Simply, the top level requirement is: to put target lines on each KPI chart. For example, the 5 sales reps in a given region might have a target of 50 sales per month each. However, this does not mean the region as a whole will have a target of 250, it may have its own target agreed independently. In addition, the targets may change month to month. So these targets are defined indepedently and are not additive up the hierarchy.
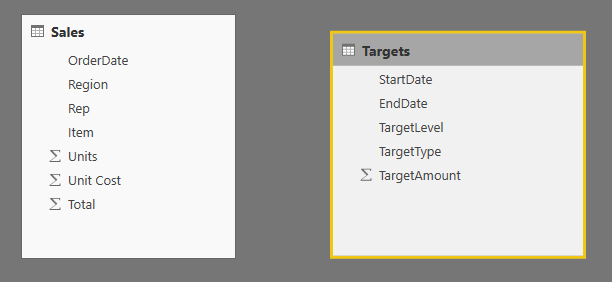
To contextualise briefly: I have a table of Sales, and a table of Targets, The Sales table contains items sold by salespersons in different regions. The grain is one row per order, where an order cosists of an item and a quantity of units sold.
Each Rep works in one and only one Region. A Region contains one or more Reps. Therefore, a hierarchy exists between Region, at the top, and Rep, at the bottom.
The Targets table is one row per KPI per Hierarchy level per time Period. Apologies in advance that this table is not more fleshed out, I got tired of making up the data. However, hopefully you get the idea. A target exists at each level in the hierarchy independently.
The targets need placing on the charts according to the level defined in the filter. For example, if I am looking at a Regional sales chart (look at the dashboard in the attached file), I should see the Regional KPI target. If I am looking at a Rep sales chart, I should have the Rep sales target. In addition, the changes to the target should be reflected accurately (e.g. let's say Rep sales target for month 1 is 50, and for month 2 is 60, so my target should show each of these data points, it should not show as an average, or straight line, of 55).
Let me know if you have any questions and thanks a lot 🙂 I have in mind to do something like SELECTEDVALUE but my DAX isn't proficient enough to solve it without some assistance.
Link to Dashboard


