- Power BI forums
- Updates
- News & Announcements
- Get Help with Power BI
- Desktop
- Service
- Report Server
- Power Query
- Mobile Apps
- Developer
- DAX Commands and Tips
- Custom Visuals Development Discussion
- Health and Life Sciences
- Power BI Spanish forums
- Translated Spanish Desktop
- Power Platform Integration - Better Together!
- Power Platform Integrations (Read-only)
- Power Platform and Dynamics 365 Integrations (Read-only)
- Training and Consulting
- Instructor Led Training
- Dashboard in a Day for Women, by Women
- Galleries
- Community Connections & How-To Videos
- COVID-19 Data Stories Gallery
- Themes Gallery
- Data Stories Gallery
- R Script Showcase
- Webinars and Video Gallery
- Quick Measures Gallery
- 2021 MSBizAppsSummit Gallery
- 2020 MSBizAppsSummit Gallery
- 2019 MSBizAppsSummit Gallery
- Events
- Ideas
- Custom Visuals Ideas
- Issues
- Issues
- Events
- Upcoming Events
- Community Blog
- Power BI Community Blog
- Custom Visuals Community Blog
- Community Support
- Community Accounts & Registration
- Using the Community
- Community Feedback
Register now to learn Fabric in free live sessions led by the best Microsoft experts. From Apr 16 to May 9, in English and Spanish.
- Power BI forums
- Forums
- Get Help with Power BI
- Desktop
- Re: Assigning rows equally across a list
- Subscribe to RSS Feed
- Mark Topic as New
- Mark Topic as Read
- Float this Topic for Current User
- Bookmark
- Subscribe
- Printer Friendly Page
- Mark as New
- Bookmark
- Subscribe
- Mute
- Subscribe to RSS Feed
- Permalink
- Report Inappropriate Content
Assigning rows equally across a list
Hello!
I'd like to be able to equally distribute records in a table to names from a list. I'm able to assign them randomly with:
| Client | Employee |
| 1 | A |
| 2 | A |
| 3 | A |
| 4 | B |
| 5 | B |
| 6 | B |
| ...... | .... |
| 31 | C |
| 32 | C |
| 33 | C |
Solved! Go to Solution.
- Mark as New
- Bookmark
- Subscribe
- Mute
- Subscribe to RSS Feed
- Permalink
- Report Inappropriate Content
Your usecase intrigued me. It seems you are trying to create some sort of daily roster? That is an interesting use of Power BI.
Anyway, onto your question. What I came up with was the following.
I assume there is a table of (unique) Clients, as well a table of (unique) Employees. You want to create a calculated column in the Clients table that assigns an Employee to each Client row, in such a manner that every Employee occurs roughly the same ammount of times in the Clients table.
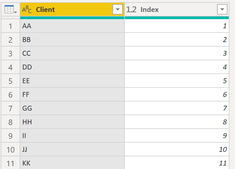
I started off with two tables, one Client Table and one Employee Table (note the Index columns! i've added those in the Query Editor!) There are 31 rows in Client table, and 5 in Employee table.


Now we are going to add a calculated column to the Client table in which we are going to assign employee ID's to Clients (evenly distributed):
AssignedEmplID =
VAR _clientsPerEmp = DIVIDE(COUNTA(TableClient[Client]), COUNTA(TableEmpl[Employee]))
RETURN
ROUNDUP(DIVIDE(TableClient[Index], _clientsPerEmp), 0)
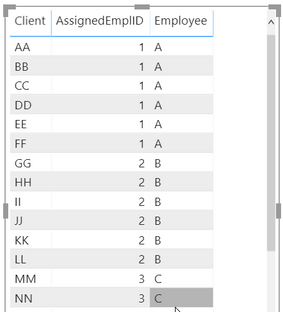
What we are doing here is calculating how many clients per employee should be assigned (divide the number clients by the number of employees). Then we divide the index of that client (let's say, 4) by that number (in our case 31 divided by 5). Round that up to the nearest whole number and that is the assigned Employee Index. Consequently; the fifth employee get's 7 clients, all other employees get 6.
Last step is to create a relationship between Employee Index and AssignedEmployee (1-to-many), so you can use names instead of indexes in your visuals, for example:

Please mark this answer as solution if this answered your question. 🙂
Did I answer your question? Mark my post as a solution!
Proud to be a Super User!
- Mark as New
- Bookmark
- Subscribe
- Mute
- Subscribe to RSS Feed
- Permalink
- Report Inappropriate Content
Hello! I've got a similar challenge which this solution helped me a lot already, however, I've got some criteria/rules:
instead of Clients and Employees - I have users and auditors - which the auditor can't audit themself (so the auditor needs to be different from the user) but always considering the same number of rows for every auditor.
Could you please help?? Thank you 🙂
- Mark as New
- Bookmark
- Subscribe
- Mute
- Subscribe to RSS Feed
- Permalink
- Report Inappropriate Content
Your usecase intrigued me. It seems you are trying to create some sort of daily roster? That is an interesting use of Power BI.
Anyway, onto your question. What I came up with was the following.
I assume there is a table of (unique) Clients, as well a table of (unique) Employees. You want to create a calculated column in the Clients table that assigns an Employee to each Client row, in such a manner that every Employee occurs roughly the same ammount of times in the Clients table.
I started off with two tables, one Client Table and one Employee Table (note the Index columns! i've added those in the Query Editor!) There are 31 rows in Client table, and 5 in Employee table.


Now we are going to add a calculated column to the Client table in which we are going to assign employee ID's to Clients (evenly distributed):
AssignedEmplID =
VAR _clientsPerEmp = DIVIDE(COUNTA(TableClient[Client]), COUNTA(TableEmpl[Employee]))
RETURN
ROUNDUP(DIVIDE(TableClient[Index], _clientsPerEmp), 0)
What we are doing here is calculating how many clients per employee should be assigned (divide the number clients by the number of employees). Then we divide the index of that client (let's say, 4) by that number (in our case 31 divided by 5). Round that up to the nearest whole number and that is the assigned Employee Index. Consequently; the fifth employee get's 7 clients, all other employees get 6.
Last step is to create a relationship between Employee Index and AssignedEmployee (1-to-many), so you can use names instead of indexes in your visuals, for example:

Please mark this answer as solution if this answered your question. 🙂
Did I answer your question? Mark my post as a solution!
Proud to be a Super User!
- Mark as New
- Bookmark
- Subscribe
- Mute
- Subscribe to RSS Feed
- Permalink
- Report Inappropriate Content
AWESOME! That's just what I needed, thanks so much!
Helpful resources

Microsoft Fabric Learn Together
Covering the world! 9:00-10:30 AM Sydney, 4:00-5:30 PM CET (Paris/Berlin), 7:00-8:30 PM Mexico City

Power BI Monthly Update - April 2024
Check out the April 2024 Power BI update to learn about new features.

| User | Count |
|---|---|
| 106 | |
| 94 | |
| 77 | |
| 65 | |
| 53 |
| User | Count |
|---|---|
| 145 | |
| 105 | |
| 104 | |
| 90 | |
| 63 |
