- Power BI forums
- Updates
- News & Announcements
- Get Help with Power BI
- Desktop
- Service
- Report Server
- Power Query
- Mobile Apps
- Developer
- DAX Commands and Tips
- Custom Visuals Development Discussion
- Health and Life Sciences
- Power BI Spanish forums
- Translated Spanish Desktop
- Power Platform Integration - Better Together!
- Power Platform Integrations (Read-only)
- Power Platform and Dynamics 365 Integrations (Read-only)
- Training and Consulting
- Instructor Led Training
- Dashboard in a Day for Women, by Women
- Galleries
- Community Connections & How-To Videos
- COVID-19 Data Stories Gallery
- Themes Gallery
- Data Stories Gallery
- R Script Showcase
- Webinars and Video Gallery
- Quick Measures Gallery
- 2021 MSBizAppsSummit Gallery
- 2020 MSBizAppsSummit Gallery
- 2019 MSBizAppsSummit Gallery
- Events
- Ideas
- Custom Visuals Ideas
- Issues
- Issues
- Events
- Upcoming Events
- Community Blog
- Power BI Community Blog
- Custom Visuals Community Blog
- Community Support
- Community Accounts & Registration
- Using the Community
- Community Feedback
Register now to learn Fabric in free live sessions led by the best Microsoft experts. From Apr 16 to May 9, in English and Spanish.
- Power BI forums
- Forums
- Get Help with Power BI
- Desktop
- Assigning Rotating Shift Team based on Service Req...
- Subscribe to RSS Feed
- Mark Topic as New
- Mark Topic as Read
- Float this Topic for Current User
- Bookmark
- Subscribe
- Printer Friendly Page
- Mark as New
- Bookmark
- Subscribe
- Mute
- Subscribe to RSS Feed
- Permalink
- Report Inappropriate Content
Assigning Rotating Shift Team based on Service Request Data
Hello,
I'm trying to systematically assign event data (Service Requests) that are generated within my company. All service requests produce 1 row of data of about 10 attributes, (Service Request #, Date/Time Created, Person Creating Request...).
The personnel who generate these requests work a 24/7 operational schedule where they are one for 12 hours straight for 2-3 days and have a day a few days off, then come back for the same shift for a few days. Thus there are 2 permanent night shift teams and 2 permanent day shift teams that. This is the Oprational Team.
The personnel that complete the service requests work a rotating shift (7 days on 1st shift (7A-3:30P), followed by a week of 2nd shift followed by a week of 3rd shift, with weekends between each work week). Thus there are 4 teams that rotate in this group. This is the Maintenance Team.
What I'm trying to do is reference a work schedule callendar Lookup so that Power BI can assign which Operational and Maintenance teams the work orders took place on.
I understand how to make conditional columns that take the time of the Service Request that was generated and automatically generate a time of day shift that this took place on (1st, 2nd, 3rd for Maintenance or Days, Nights for Operations). What I don't know how to do though is to have Power BI reference my calendar lookup table to populate which teams (Team 1, Team 2, Team 3, Team 4) the work orders occured on.
If anyone can help me with this, I'd very much appreciate it.
Thanks!
- Mark as New
- Bookmark
- Subscribe
- Mute
- Subscribe to RSS Feed
- Permalink
- Report Inappropriate Content
Lastly,
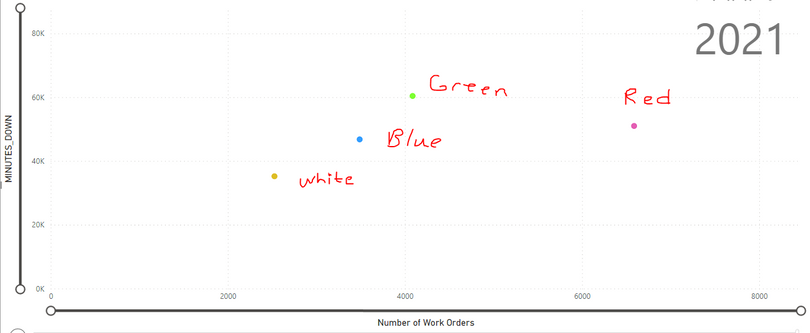
The final data (viewed in Power BI) would look something like this, as an example, to allow a clear comparision of each Operations Team on a single graph.
- Mark as New
- Bookmark
- Subscribe
- Mute
- Subscribe to RSS Feed
- Permalink
- Report Inappropriate Content
Hi, @Anonymous
First of all, your data is shared in the form of screenshots, we can not test and use, and the dates of the two tables are very different.
Secondly, I tried to understand your needs, but failed. Please tell your calculation logic directly, or clearly describe your needs(Don't speak abstractly). If you don’t know what you want, how can we help you?
I suggest you refer to this document to learn how to post effectively:
How to Get Your Question Answered Quickly - Microsoft Power BI Community
Did I answer your question ? Please mark my reply as solution. Thank you very much.
If not, please upload some insensitive data samples and expected output.
Best Regards,
Community Support Team _ Janey
- Mark as New
- Bookmark
- Subscribe
- Mute
- Subscribe to RSS Feed
- Permalink
- Report Inappropriate Content
Can you share some sample data with the desired output to have a clear understanding of your question?
Mention whether you want a calculated column or measure.
You can either paste your data in the reply box or save it in OneDrive, Google Drive, or any other cloud-sharing platform and share the link here.
⭕ Subscribe and learn Power BI from these videos
⚪ Website ⚪ LinkedIn ⚪ PBI User Group
- Mark as New
- Bookmark
- Subscribe
- Mute
- Subscribe to RSS Feed
- Permalink
- Report Inappropriate Content
Fowmy,
Thanks for taking the time to try to help me with this. Below is some example data.
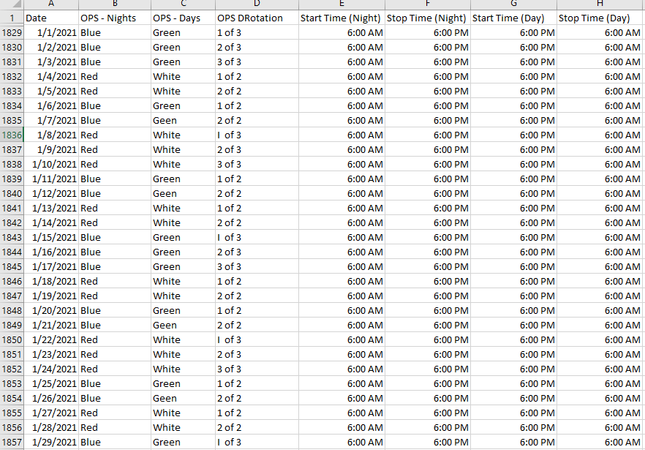
The top one is a calendar lookup. Very simple, just has the data and the Team for each rotation based on the schedule (Blue, Green, Red, White are the teams). 2 teams alternate back and forth on nights with eachother and the other two alternate back and forth on days.
The table below that is a very abreviated version of the Service Request data that we get. Essentially, each Service Request is made to get a Technician to respond and fix a piece of equipment. There are a lot more data columns in this data set, but it's not relevant for this discussion. So, what I'm trying to do is have Power BI automatically assign each Service Request (Job Number in bottom table) to the applicable rotating Ops Team, based on the Time & Day that the request was made (Create_Sched_Date in the bottom table).
You asked if I want a Column or Measure, but to be honest, I'm not 100% sure. Of how I understand DAX and Measures and Columns, I think I want Measure Data.
When all is said and done, I'd like to have a data variable (Ops Team) that I can use for filtering (i.e. show me all the Service Requests by each shift in a bar chart, or show me all how much total Minutes_Down, an attribute of every Service Requst, each shift has had.
Hope all this makes sense. In my head, it's very simple in concept. In practice, I don't know how to make Power BI do this.
Your help is much appreciated! Thanks!
Helpful resources

Microsoft Fabric Learn Together
Covering the world! 9:00-10:30 AM Sydney, 4:00-5:30 PM CET (Paris/Berlin), 7:00-8:30 PM Mexico City

Power BI Monthly Update - April 2024
Check out the April 2024 Power BI update to learn about new features.

| User | Count |
|---|---|
| 110 | |
| 94 | |
| 81 | |
| 66 | |
| 58 |
| User | Count |
|---|---|
| 150 | |
| 119 | |
| 104 | |
| 87 | |
| 67 |


