- Power BI forums
- Updates
- News & Announcements
- Get Help with Power BI
- Desktop
- Service
- Report Server
- Power Query
- Mobile Apps
- Developer
- DAX Commands and Tips
- Custom Visuals Development Discussion
- Health and Life Sciences
- Power BI Spanish forums
- Translated Spanish Desktop
- Power Platform Integration - Better Together!
- Power Platform Integrations (Read-only)
- Power Platform and Dynamics 365 Integrations (Read-only)
- Training and Consulting
- Instructor Led Training
- Dashboard in a Day for Women, by Women
- Galleries
- Community Connections & How-To Videos
- COVID-19 Data Stories Gallery
- Themes Gallery
- Data Stories Gallery
- R Script Showcase
- Webinars and Video Gallery
- Quick Measures Gallery
- 2021 MSBizAppsSummit Gallery
- 2020 MSBizAppsSummit Gallery
- 2019 MSBizAppsSummit Gallery
- Events
- Ideas
- Custom Visuals Ideas
- Issues
- Issues
- Events
- Upcoming Events
- Community Blog
- Power BI Community Blog
- Custom Visuals Community Blog
- Community Support
- Community Accounts & Registration
- Using the Community
- Community Feedback
Register now to learn Fabric in free live sessions led by the best Microsoft experts. From Apr 16 to May 9, in English and Spanish.
- Power BI forums
- Forums
- Get Help with Power BI
- Desktop
- Agrupar kpis en función de la seleccion de usuario
- Subscribe to RSS Feed
- Mark Topic as New
- Mark Topic as Read
- Float this Topic for Current User
- Bookmark
- Subscribe
- Printer Friendly Page
- Mark as New
- Bookmark
- Subscribe
- Mute
- Subscribe to RSS Feed
- Permalink
- Report Inappropriate Content
Agrupar kpis en función de la seleccion de usuario
Hola, me gustaría mostrar los kpis agrupados por una categoría, en funciom de lo que elija el usuario final.
Si. Quiere ver la info por edad, o por sexo o por país.
Que esto (edad. Sexo o pais) sea un filtro y según la selección del user laninf. Se muestre en una tabla agrupada por los valores de la categoria seleccionada.
- Mark as New
- Bookmark
- Subscribe
- Mute
- Subscribe to RSS Feed
- Permalink
- Report Inappropriate Content
Hi , @IsaTMK
You may check if this thread helps.
https://community.powerbi.com/t5/Desktop/Grouping-dates-and-KPIs-by-category/m-p/1072232
If it doesn't meet your requierment,please share more details.
Best Regards,
Community Support Team _ Eason
- Mark as New
- Bookmark
- Subscribe
- Mute
- Subscribe to RSS Feed
- Permalink
- Report Inappropriate Content
Hola,
No no me sirve este hilo, he adjuntado mas detalle, espero me puedan ayudar
- Mark as New
- Bookmark
- Subscribe
- Mute
- Subscribe to RSS Feed
- Permalink
- Report Inappropriate Content
Hello
Yes, I'm sorry.
I compare an example image, the purpose is to be able to display the info. in the "dimension" row, by any of the dimensions of the button above shown (Year, Campaign, Channel, Date,Month,Supplier)
As the user, select why you want to view the info. the table must change its row value to the one selected in the button.
I don't want to use the following two options:
- bookmark
- No joined queries (it's how I now work but it replicates me a lot of info. without needing to be)
- Mark as New
- Bookmark
- Subscribe
- Mute
- Subscribe to RSS Feed
- Permalink
- Report Inappropriate Content
Why don't you want to use bookmarks?
One way of doing this is to set up a table with the values you want to use in the slicer. You then have to write measures using the SWITCH function to return the calculations based on the SELECTEDVALUE on the "Slicer".
It does however seem potentially laborious if compared to using bookmarks.
Did I answer your question? Mark my post as a solution!
In doing so, you are also helping me. Thank you!
Proud to be a Super User!
Paul on Linkedin.
- Mark as New
- Bookmark
- Subscribe
- Mute
- Subscribe to RSS Feed
- Permalink
- Report Inappropriate Content
Hello
When you use a lot of groupings, I find it complex to maintain. I'm data and I'd rather handle everything in it.
The option you expose to me only serves to change metrics, this is not calculations, only change the value of the field to group and with the selectvalue I have not been able to solve it
- Mark as New
- Bookmark
- Subscribe
- Mute
- Subscribe to RSS Feed
- Permalink
- Report Inappropriate Content
@IsaTMK
I'm not following you. You'll have to change metrics based on the selection in the Slicer. What do you mean when you say they're not calculations?
Did I answer your question? Mark my post as a solution!
In doing so, you are also helping me. Thank you!
Proud to be a Super User!
Paul on Linkedin.
- Mark as New
- Bookmark
- Subscribe
- Mute
- Subscribe to RSS Feed
- Permalink
- Report Inappropriate Content
Metrics are fixed, they're always the same.
The only thing I change is which field/column I want to show those grouped metrics.
- Mark as New
- Bookmark
- Subscribe
- Mute
- Subscribe to RSS Feed
- Permalink
- Report Inappropriate Content
If the values in the slicer are one-column, and are related to the data tables, they will function as a filter directly. If they are not columns, or you relate to the data table, or you have to indicate what should be calculated with the selection as I have suggested.
Do you have a dummy example of PBIX data/file?
Did I answer your question? Mark my post as a solution!
In doing so, you are also helping me. Thank you!
Proud to be a Super User!
Paul on Linkedin.
- Mark as New
- Bookmark
- Subscribe
- Mute
- Subscribe to RSS Feed
- Permalink
- Report Inappropriate Content
Hello
I make it clear, the report I already have it painted as it should be but I know that it is not the most efficient way since I use union and replicate data.
Imagine that I have this view, and in the pbxi I want to show the sum of the two metrics, but grouped by name or age, as the end user chooses me. ( without using bookmark, this in a ridiculous example, in the real I have up to 20 columns by which to give the user to see the grouped information)
I hope I've explained myself
- Mark as New
- Bookmark
- Subscribe
- Mute
- Subscribe to RSS Feed
- Permalink
- Report Inappropriate Content
Look at this example:
Did I answer your question? Mark my post as a solution!
In doing so, you are also helping me. Thank you!
Proud to be a Super User!
Paul on Linkedin.
- Mark as New
- Bookmark
- Subscribe
- Mute
- Subscribe to RSS Feed
- Permalink
- Report Inappropriate Content
Simple example,
I want to choose to group metrica1 by Name or by Age in the table, as you choose in the filter,
The calculation I'm applying in "Column" always goes down the else..
- Mark as New
- Bookmark
- Subscribe
- Mute
- Subscribe to RSS Feed
- Permalink
- Report Inappropriate Content
In the example you set, the result of the evaluation of the SWITCH function is a column; has to be a measure or fixed value. Cannot be a list (of a column).
Let's see if this helps:
Did I answer your question? Mark my post as a solution!
In doing so, you are also helping me. Thank you!
Proud to be a Super User!
Paul on Linkedin.
- Mark as New
- Bookmark
- Subscribe
- Mute
- Subscribe to RSS Feed
- Permalink
- Report Inappropriate Content
I'm sorry, but I don't quite understand your example.
The final table should always have metrica1 and metric 2 (in your example) and the column by which to group is the age or name value.
I do not understand very well the end of your example, you can do it by choosing "Name", in type selection and the final table has three columns, the two metrics and the "field" type selection?
- Mark as New
- Bookmark
- Subscribe
- Mute
- Subscribe to RSS Feed
- Permalink
- Report Inappropriate Content
I don't know how to make row values from different columns dynamic only by using DAX.
This can be done by creating a table that includes:
1) The values you're going to use as a Slicer ("Selección" in my example below)
2) All unique values associated with that selection value (1) ("Valor" in my example below)
This is relatively easy to do in Power Query
For example:

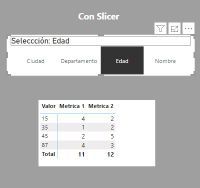
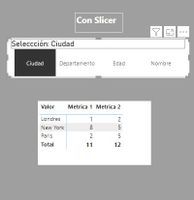
You then create measures that act on the selection in the Slicer, and that group based on the values that top the table or matrix.
The model I have looks like this:
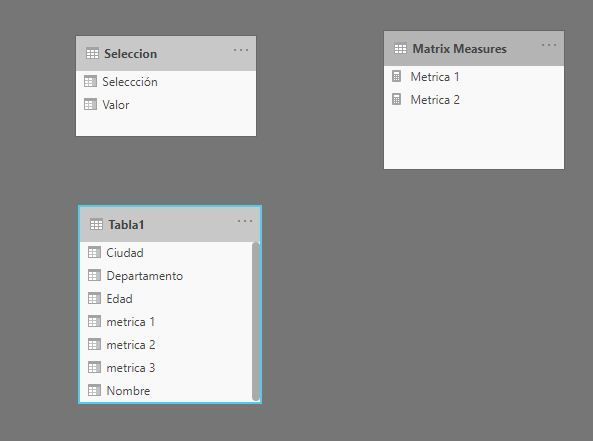
The data table:

Metrics I use the TREATAS function to associate the column in the data table with the values selected in the Slicer:
Metrica 1 =
VAR SumaNombre = CALCULATE([Suma Metrica 1], TREATAS(VALUES(Seleccion[Valor]), Tabla1[Nombre]))
VAR SumaEdad = CALCULATE([Suma Metrica 1], TREATAS(VALUES(Seleccion[Valor]), Tabla1[Edad]))
VAR SumaDepartamento = CALCULATE([Suma Metrica 1], TREATAS(VALUES(Seleccion[Valor]), Tabla1[Departamento]))
VAR SumaCiudad = CALCULATE([Suma Metrica 1], TREATAS(VALUES(Seleccion[Valor]), Tabla1[Ciudad]))
RETURN
SWITCH(TRUE(),
SELECTEDVALUE(Seleccion[Seleccción]) = "Nombre", SumaNombre,
SELECTEDVALUE(Seleccion[Seleccción]) = "Edad", SumaEdad,
SELECTEDVALUE(Seleccion[Seleccción]) = "Departamento", SumaDepartamento,
SumaCiudad)
And with this the selection of values in the table/matrix become dynamic:

I don't know any other way.
Tell me if the PBIX file is good for uploading.
Did I answer your question? Mark my post as a solution!
In doing so, you are also helping me. Thank you!
Proud to be a Super User!
Paul on Linkedin.
- Mark as New
- Bookmark
- Subscribe
- Mute
- Subscribe to RSS Feed
- Permalink
- Report Inappropriate Content
Hello
I evoke it and I tell you
Thanks a lot
- Mark as New
- Bookmark
- Subscribe
- Mute
- Subscribe to RSS Feed
- Permalink
- Report Inappropriate Content
Hi , @IsaTMK
Could you please tell me whether your problem has been solved?
If it is, please mark the helpful replies or add your reply as Answered to close this thread.
It will help other community members easily find the solution when they get the similar issue.
Best Regards,
Community Support Team _ Eason
- Mark as New
- Bookmark
- Subscribe
- Mute
- Subscribe to RSS Feed
- Permalink
- Report Inappropriate Content
Hello, good morning
Finally, I was able to fix it in a super fast way.
Using the Power Bi Unpivot option. In this one you can choose which fields you want to dynaminte and be able to play with them in a filter.
- Mark as New
- Bookmark
- Subscribe
- Mute
- Subscribe to RSS Feed
- Permalink
- Report Inappropriate Content
OK. Let us know how it goes (and if you need the sample PBIX file)
Did I answer your question? Mark my post as a solution!
In doing so, you are also helping me. Thank you!
Proud to be a Super User!
Paul on Linkedin.
- Mark as New
- Bookmark
- Subscribe
- Mute
- Subscribe to RSS Feed
- Permalink
- Report Inappropriate Content
- Mark as New
- Bookmark
- Subscribe
- Mute
- Subscribe to RSS Feed
- Permalink
- Report Inappropriate Content
Hi Paul,
Thank you, what you show in the example is a metric field that changes the metric to be displayed, but not the vble by which you group that metric which is what I really need.
Helpful resources

Microsoft Fabric Learn Together
Covering the world! 9:00-10:30 AM Sydney, 4:00-5:30 PM CET (Paris/Berlin), 7:00-8:30 PM Mexico City

Power BI Monthly Update - April 2024
Check out the April 2024 Power BI update to learn about new features.

Fabric Community Update - April 2024
Find out what's new and trending in the Fabric Community.

| User | Count |
|---|---|
| 116 | |
| 102 | |
| 78 | |
| 77 | |
| 49 |
| User | Count |
|---|---|
| 145 | |
| 108 | |
| 107 | |
| 89 | |
| 61 |