- Power BI forums
- Updates
- News & Announcements
- Get Help with Power BI
- Desktop
- Service
- Report Server
- Power Query
- Mobile Apps
- Developer
- DAX Commands and Tips
- Custom Visuals Development Discussion
- Health and Life Sciences
- Power BI Spanish forums
- Translated Spanish Desktop
- Power Platform Integration - Better Together!
- Power Platform Integrations (Read-only)
- Power Platform and Dynamics 365 Integrations (Read-only)
- Training and Consulting
- Instructor Led Training
- Dashboard in a Day for Women, by Women
- Galleries
- Community Connections & How-To Videos
- COVID-19 Data Stories Gallery
- Themes Gallery
- Data Stories Gallery
- R Script Showcase
- Webinars and Video Gallery
- Quick Measures Gallery
- 2021 MSBizAppsSummit Gallery
- 2020 MSBizAppsSummit Gallery
- 2019 MSBizAppsSummit Gallery
- Events
- Ideas
- Custom Visuals Ideas
- Issues
- Issues
- Events
- Upcoming Events
- Community Blog
- Power BI Community Blog
- Custom Visuals Community Blog
- Community Support
- Community Accounts & Registration
- Using the Community
- Community Feedback
Register now to learn Fabric in free live sessions led by the best Microsoft experts. From Apr 16 to May 9, in English and Spanish.
- Power BI forums
- Forums
- Get Help with Power BI
- Desktop
- Re: Aggregate values by Year-Month
- Subscribe to RSS Feed
- Mark Topic as New
- Mark Topic as Read
- Float this Topic for Current User
- Bookmark
- Subscribe
- Printer Friendly Page
- Mark as New
- Bookmark
- Subscribe
- Mute
- Subscribe to RSS Feed
- Permalink
- Report Inappropriate Content
Aggregate values by Year-Month
Hello All,
Im a fairly new user on PowerBI and i would like to do the following calculation in the application.
Example: I have various projects for which I issue multiple invoices to clients (turnover) and I also receive multiple invoices from partners (Cost). The projects can last from 1 month and up to 5 months. This means that these invoices have different issued dates.
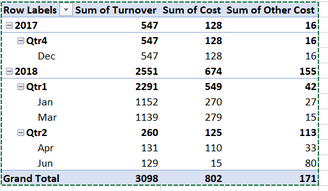
The first report that i created has the total turnover and cost by month (top table in the image).
Now i want to create another report on which i would like to see the state of the projects up to a specific point of time (in this case, month). This means that i need to aggregate the values up to this point of time.
In the following image the top table shows the performance of the projects for each one of the months separately and the table at the bottom shows the aggregated information by month.
My difficulty is to create the aggregated formula for the calculation on column C, D and E (Cells C9 to E12). One tricky bit is that the aggregation must also work on months which fall on 2 different years.
Thanks
Solved! Go to Solution.
- Mark as New
- Bookmark
- Subscribe
- Mute
- Subscribe to RSS Feed
- Permalink
- Report Inappropriate Content
@themistoklis You're welcome 🙂
Try this:
Cumulative Turnover = CALCULATE(SUM(Table1[turnovert]),
FILTER(
ALL('Calendar 1'[Date]),
	'Calendar 1'[Date] <= MAX(Table1[Date])))
Cumualtive Cost = CALCULATE(SUM(Table1[Cost]),
FILTER(
ALL('Calendar 1'[Date]),
'Calendar 1'[Date] <= MAX(Table1[Date])))Cumulative Other Cost = CALCULATE(SUM(Table1[Other Cost]),
FILTER(
ALL('Calendar 1'[Date]),
'Calendar 1'[Date] <= MAX(Table1[Date])))Profit is as before.
- Mark as New
- Bookmark
- Subscribe
- Mute
- Subscribe to RSS Feed
- Permalink
- Report Inappropriate Content
Assuming i understood you correctly try this.
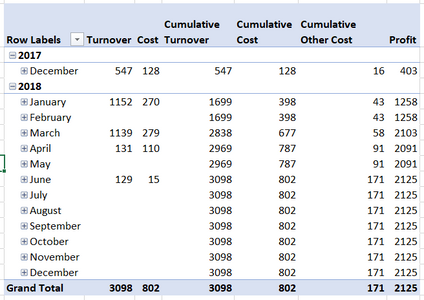
First create a Calendar table, if you are so new that this is unfamiliar, let me know. Then create a relationship to your data table. I created a small table for my self, and the initial pivot is like this.
Turned into:
By these formulas:
Cummulative Turnover = CALCULATE(SUM(Table1[turnover]),
FILTER(
ALL('Calendar 1'[Date]),
	'Calendar 1'[Date] <= MAX('Calendar 1'[Date])))
Cummulative Cost = CALCULATE(SUM(Table1[Cost]),
FILTER(
ALL('Calendar 1'[Date]),
'Calendar 1'[Date] <= MAX('Calendar 1'[Date])))Cummulative Other Cost = CALCULATE(SUM(Table1[Other Cost]),
FILTER(
ALL('Calendar 1'[Date]),
'Calendar 1'[Date] <= MAX('Calendar 1'[Date])))Profit = [Cumulative Turnover]-[Cumulative Cost]-[Cumulative Other Cost]
- Mark as New
- Bookmark
- Subscribe
- Mute
- Subscribe to RSS Feed
- Permalink
- Report Inappropriate Content
Thanks a lot for your answer. This is nearly what i need...
Only one small correction. I forgot to mention that on the initial message, Apologies for that.
I want to see all the metrics up untill the date of the last invoicing document.
In your example it is June. So all the calculations are correct up untill June.
After June the values must be zero. If we could ammend the formulas so as to take into account this rule that would be amazing.
As for the Calendar table i managed to create it on PowerBI. So im ok with that. That's for offering your help on this.
- Mark as New
- Bookmark
- Subscribe
- Mute
- Subscribe to RSS Feed
- Permalink
- Report Inappropriate Content
@themistoklis You're welcome 🙂
Try this:
Cumulative Turnover = CALCULATE(SUM(Table1[turnovert]),
FILTER(
ALL('Calendar 1'[Date]),
	'Calendar 1'[Date] <= MAX(Table1[Date])))
Cumualtive Cost = CALCULATE(SUM(Table1[Cost]),
FILTER(
ALL('Calendar 1'[Date]),
'Calendar 1'[Date] <= MAX(Table1[Date])))Cumulative Other Cost = CALCULATE(SUM(Table1[Other Cost]),
FILTER(
ALL('Calendar 1'[Date]),
'Calendar 1'[Date] <= MAX(Table1[Date])))Profit is as before.
- Mark as New
- Bookmark
- Subscribe
- Mute
- Subscribe to RSS Feed
- Permalink
- Report Inappropriate Content
Helpful resources

Microsoft Fabric Learn Together
Covering the world! 9:00-10:30 AM Sydney, 4:00-5:30 PM CET (Paris/Berlin), 7:00-8:30 PM Mexico City

Power BI Monthly Update - April 2024
Check out the April 2024 Power BI update to learn about new features.

| User | Count |
|---|---|
| 117 | |
| 105 | |
| 69 | |
| 67 | |
| 43 |
| User | Count |
|---|---|
| 148 | |
| 103 | |
| 103 | |
| 88 | |
| 66 |


