- Power BI forums
- Updates
- News & Announcements
- Get Help with Power BI
- Desktop
- Service
- Report Server
- Power Query
- Mobile Apps
- Developer
- DAX Commands and Tips
- Custom Visuals Development Discussion
- Health and Life Sciences
- Power BI Spanish forums
- Translated Spanish Desktop
- Power Platform Integration - Better Together!
- Power Platform Integrations (Read-only)
- Power Platform and Dynamics 365 Integrations (Read-only)
- Training and Consulting
- Instructor Led Training
- Dashboard in a Day for Women, by Women
- Galleries
- Community Connections & How-To Videos
- COVID-19 Data Stories Gallery
- Themes Gallery
- Data Stories Gallery
- R Script Showcase
- Webinars and Video Gallery
- Quick Measures Gallery
- 2021 MSBizAppsSummit Gallery
- 2020 MSBizAppsSummit Gallery
- 2019 MSBizAppsSummit Gallery
- Events
- Ideas
- Custom Visuals Ideas
- Issues
- Issues
- Events
- Upcoming Events
- Community Blog
- Power BI Community Blog
- Custom Visuals Community Blog
- Community Support
- Community Accounts & Registration
- Using the Community
- Community Feedback
Register now to learn Fabric in free live sessions led by the best Microsoft experts. From Apr 16 to May 9, in English and Spanish.
- Power BI forums
- Forums
- Get Help with Power BI
- Desktop
- Re: Age of tickets % - Month to Month Trend
- Subscribe to RSS Feed
- Mark Topic as New
- Mark Topic as Read
- Float this Topic for Current User
- Bookmark
- Subscribe
- Printer Friendly Page
- Mark as New
- Bookmark
- Subscribe
- Mute
- Subscribe to RSS Feed
- Permalink
- Report Inappropriate Content
Age of tickets % - Month to Month Trend
Hi
appreciate any help and hopefully i can explain this well enough
looking to provide a month to month % trend graph of tickets open longer than 6 months (or 183 days) against the total count of all tickets
seems simple enough and ive been using a custom column to produce a running age of the item. this works fine when i want to categorise the age of items in open in day ranges or simply show how long something has been open for each day based on todays date
the below is a sample of how my data is broken up
"Running Age" is simply a column Datediff on Todays date minus the created date to get days open for
| Work Items | Status | Created Date | Running Age |
| Item 1 | Open | 04/02/2019 | 365 |
| Item 2 | Open | 05/03/2019 | 336 |
| Item 3 | Open | 06/04/2019 | 304 |
| Item 4 | Open | 07/05/2019 | 273 |
| Item 5 | Open | 08/06/2019 | 241 |
| Item 6 | Open | 09/07/2019 | 210 |
| Item 7 | Open | 10/08/2019 | 178 |
| Item 8 | Open | 11/09/2019 | 146 |
| Item 9 | Open | 12/10/2019 | 115 |
| Item 10 | Open | 13/11/2019 | 83 |
| Item 11 | Open | 14/12/2019 | 52 |
| Item 12 | Open | 15/01/2020 | 20 |
my formula for calculating the count of items older than 6 months is
then use that to divide against the total in this measure
when i want to determine the % trend for previous months i get stuck. Currently when the report updates it factors in what todays date is, rather than that month in time i.e. in Nov 2019
trying to work out how i can show that snapshot in time of what was older than 6 months? i am assuming i have been using the running age incorrectly
| Date | Open Items (total count) | Open items older than 6 months | % of items older than 6 months |
| Nov 2019 | 10 | 4 | 40% |
| Dec 2019 | 11 | 5 | 45% |
| Jan 2020 | 12 | 6 | 50% |
| Feb 2020 | 12 | 6 | 50% |
Solved! Go to Solution.
- Mark as New
- Bookmark
- Subscribe
- Mute
- Subscribe to RSS Feed
- Permalink
- Report Inappropriate Content
Use date calendar and formula like this
Running Age (Open > 6 months) =
CALCULATE(
COUNTROWS('Work Items'), FILTER('Work Items', datediff(	Created Date,max(date[date]),Month)> 6))
Appreciate your Kudos. In case, this is the solution you are looking for, mark it as the Solution. In case it does not help, please provide additional information and mark me with @
Thanks. My Recent Blog -
Winner-Topper-on-Map-How-to-Color-States-on-a-Map-with-Winners , HR-Analytics-Active-Employee-Hire-and-Termination-trend
Power-BI-Working-with-Non-Standard-Time-Periods And Comparing-Data-Across-Date-Ranges
Connect on Linkedin
Microsoft Power BI Learning Resources, 2023 !!
Learn Power BI - Full Course with Dec-2022, with Window, Index, Offset, 100+ Topics !!
Did I answer your question? Mark my post as a solution! Appreciate your Kudos !! Proud to be a Super User! !!
- Mark as New
- Bookmark
- Subscribe
- Mute
- Subscribe to RSS Feed
- Permalink
- Report Inappropriate Content
@amitchandak
thanks for the help. i might be missing something. i did a manual count of the current data and the end calculation using your formula isnt the same
in comparison, the data driven by your formula only goes back to Oct/Nov
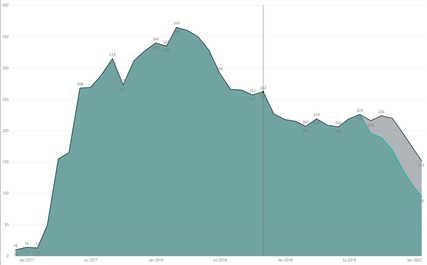
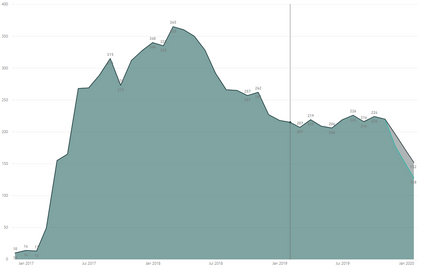
as per below graphs,
left one shows my the total of all issues against the ones older than 6 months. but incorrectly factors in todays date minus 6 months
the right is showing the output of your formula. not sure why its only going back to Oct/Nov period??


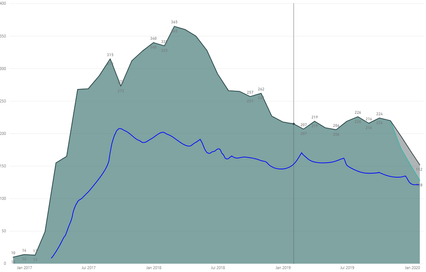
essentially the graph should look something like the below with the blue line showing the count of items per month older than 6 months compared against the total of all issues
- Mark as New
- Bookmark
- Subscribe
- Mute
- Subscribe to RSS Feed
- Permalink
- Report Inappropriate Content
SCRAP ABOVE!!!
realised i was using a wrong date field
ill run the report and compare against manual data and report back!
- Mark as New
- Bookmark
- Subscribe
- Mute
- Subscribe to RSS Feed
- Permalink
- Report Inappropriate Content
Helpful resources

Microsoft Fabric Learn Together
Covering the world! 9:00-10:30 AM Sydney, 4:00-5:30 PM CET (Paris/Berlin), 7:00-8:30 PM Mexico City

Power BI Monthly Update - April 2024
Check out the April 2024 Power BI update to learn about new features.

| User | Count |
|---|---|
| 117 | |
| 105 | |
| 69 | |
| 67 | |
| 43 |
| User | Count |
|---|---|
| 150 | |
| 103 | |
| 103 | |
| 88 | |
| 66 |

