- Power BI forums
- Updates
- News & Announcements
- Get Help with Power BI
- Desktop
- Service
- Report Server
- Power Query
- Mobile Apps
- Developer
- DAX Commands and Tips
- Custom Visuals Development Discussion
- Health and Life Sciences
- Power BI Spanish forums
- Translated Spanish Desktop
- Power Platform Integration - Better Together!
- Power Platform Integrations (Read-only)
- Power Platform and Dynamics 365 Integrations (Read-only)
- Training and Consulting
- Instructor Led Training
- Dashboard in a Day for Women, by Women
- Galleries
- Community Connections & How-To Videos
- COVID-19 Data Stories Gallery
- Themes Gallery
- Data Stories Gallery
- R Script Showcase
- Webinars and Video Gallery
- Quick Measures Gallery
- 2021 MSBizAppsSummit Gallery
- 2020 MSBizAppsSummit Gallery
- 2019 MSBizAppsSummit Gallery
- Events
- Ideas
- Custom Visuals Ideas
- Issues
- Issues
- Events
- Upcoming Events
- Community Blog
- Power BI Community Blog
- Custom Visuals Community Blog
- Community Support
- Community Accounts & Registration
- Using the Community
- Community Feedback
Register now to learn Fabric in free live sessions led by the best Microsoft experts. From Apr 16 to May 9, in English and Spanish.
- Power BI forums
- Forums
- Get Help with Power BI
- Desktop
- Add target line for each filter in slicer
- Subscribe to RSS Feed
- Mark Topic as New
- Mark Topic as Read
- Float this Topic for Current User
- Bookmark
- Subscribe
- Printer Friendly Page
- Mark as New
- Bookmark
- Subscribe
- Mute
- Subscribe to RSS Feed
- Permalink
- Report Inappropriate Content
Add target line for each filter in slicer
Hi all,
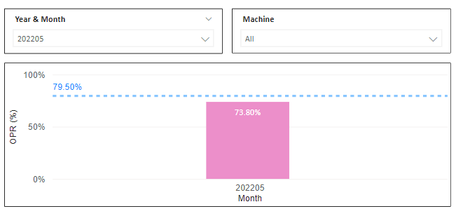
Want to ask for below chart. For chart A, I add a constant line for overall machine target (79.5%)
But when I choose certain machine (eg: 310 EA Machine) the target should be different, but as you can see below the constant line remain (79.5%) which is wrong.
Chart A
Chart B
I know constant line are no possible for my solution. Do you have suggestion how can I do a target line based on each machine (filter).
Regards,
Nuha
Solved! Go to Solution.
- Mark as New
- Bookmark
- Subscribe
- Mute
- Subscribe to RSS Feed
- Permalink
- Report Inappropriate Content
Hi @nuhasan ,
I created some data:
Here are the steps you can follow:
1. Create calculated table.
Slicer_Machine =
DISTINCT('Table'[Machine])
Slicer_Yearmonth =
DISTINCT('Table'[Year & Month])2. Create measure.
select_value =
var _year=SELECTEDVALUE('Slicer_Yearmonth'[Year & Month])
var _group=SELECTEDVALUE('Slicer_Machine'[Machine])
var _month=CALCULATE(MAX('Table'[Date].[Month]),FILTER(ALL('Table'),'Table'[Year & Month]=_year))
return
DIVIDE(
CALCULATE(SUM('Table'[Amount]),FILTER(ALL('Table'),'Table'[Date].[Month]=_month&&'Table'[Machine]=_group)),
CALCULATE(SUM('Table'[Amount]),FILTER(ALL('Table'),'Table'[Date].[Month]=_month)))
month_amount =
var _year=SELECTEDVALUE('Slicer_Yearmonth'[Year & Month])
var _group=SELECTEDVALUE('Slicer_Machine'[Machine])
var _month=CALCULATE(MAX('Table'[Date].[Month]),FILTER(ALL('Table'),'Table'[Year & Month]=_year))
return
CALCULATE(SUM('Table'[Amount]),FILTER(ALL('Table'),'Table'[Date].[Month]=_month)
)Flag =
var _year=SELECTEDVALUE('Slicer_Yearmonth'[Year & Month])
var _group=SELECTEDVALUE('Slicer_Machine'[Machine])
var _month=CALCULATE(MAX('Table'[Date].[Month]),FILTER(ALL('Table'),'Table'[Year & Month]=_year))
return
IF(
FORMAT(MAX('Table'[Date]),"mmmm")=_month,1,0)3. Place [Flag]in Filters, set is=1, apply filter.
4. Result:
Machine == A
Machine == B
Best Regards,
Liu Yang
If this post helps, then please consider Accept it as the solution to help the other members find it more quickly
- Mark as New
- Bookmark
- Subscribe
- Mute
- Subscribe to RSS Feed
- Permalink
- Report Inappropriate Content
Hi,
How should the target be calculated? What is the logic of that calculation?
Regards,
Ashish Mathur
http://www.ashishmathur.com
https://www.linkedin.com/in/excelenthusiasts/
- Mark as New
- Bookmark
- Subscribe
- Mute
- Subscribe to RSS Feed
- Permalink
- Report Inappropriate Content
Hi @Ashish_Mathur ,
There is no calculaton for target. We just input the target based on virtual discussion.
For example,
| Machine | Target | Result for May22 (202205) |
| 310 EA Machine | 94.6% | 80.99% |
Regards,
Nuha
- Mark as New
- Bookmark
- Subscribe
- Mute
- Subscribe to RSS Feed
- Permalink
- Report Inappropriate Content
@nuhasan , Then you need to create a measure and use that as a constant line or create a clustered bar visual
Switch (true() ,
not(isfiltered(Table[Machine])) , 79.5 ,
max(Table[Machine]) = "310 EA Machine", 70.0
)
Add others as per need
Microsoft Power BI Learning Resources, 2023 !!
Learn Power BI - Full Course with Dec-2022, with Window, Index, Offset, 100+ Topics !!
Did I answer your question? Mark my post as a solution! Appreciate your Kudos !! Proud to be a Super User! !!
- Mark as New
- Bookmark
- Subscribe
- Mute
- Subscribe to RSS Feed
- Permalink
- Report Inappropriate Content
For clustered bar visual, how to combine stacked column chart with line chart?
Helpful resources

Microsoft Fabric Learn Together
Covering the world! 9:00-10:30 AM Sydney, 4:00-5:30 PM CET (Paris/Berlin), 7:00-8:30 PM Mexico City

Power BI Monthly Update - April 2024
Check out the April 2024 Power BI update to learn about new features.

| User | Count |
|---|---|
| 114 | |
| 99 | |
| 83 | |
| 70 | |
| 60 |
| User | Count |
|---|---|
| 150 | |
| 115 | |
| 104 | |
| 89 | |
| 65 |


