I'm trying to make a table with sales comparing to total sales in percentage. This table is showing top 5 SKUs by sales by using the visual level filter.
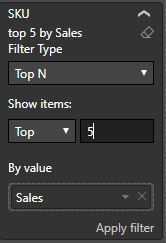
However, when I compare the sales to total sales, I want to compare with all of the SKUs, not just the top 5. Also, this should still works with other slicers. Please find the example below:
Raw Data
| Client Name | SKU | SKU Name | Month | Sales |
| A | A11 | AAA | Jan | 50 |
| A | A22 | BBB | Jan | 30 |
| A | A33 | CCC | Jan | 10 |
| A | A44 | DDD | Jan | 55 |
| A | A55 | EEE | Jan | 60 |
| A | A66 | FFF | Jan | 80 |
| A | A77 | GGG | Jan | 20 |
| A | A88 | HHH | Jan | 100 |
| A | A11 | AAA | Feb | 30 |
| A | A22 | BBB | Feb | 60 |
| A | A33 | CCC | Feb | 80 |
| A | A44 | DDD | Feb | 90 |
| A | A55 | EEE | Feb | 120 |
| A | A66 | FFF | Feb | 50 |
| A | A77 | GGG | Feb | 10 |
| A | A88 | HHH | Feb | 5 |
So the result table would shows something like this (when user did not use any slicer)
| SKU | SKU Name | Sales | Total Sales | % Total Sales |
| A55 | EEE | 180 | 855 | 21% |
| A44 | DDD | 145 | 855 | 17% |
| A66 | FFF | 130 | 855 | 15% |
| A88 | HHH | 105 | 855 | 12% |
| A33 | CCC | 95 | 855 | 11% |
And this should be the result if the user select only the month of Feb
| SKU | SKU Name | Sales | Total Sales | % Total Sales |
| A55 | EEE | 120 | 445 | 27% |
| A44 | DDD | 90 | 445 | 20% |
| A33 | FFF | 80 | 445 | 18% |
| A22 | HHH | 60 | 445 | 13% |
| A66 | CCC | 50 | 445 | 11% |
If I use ALL(), I will always get all the month even when user select only Feb, If I use ALLSELECTED(), I will only got the total sales of the top 5 shown, so the second table the total sales will be 120+90+80+60+50 = 400 instead of 445.
Any advice on how can I get Total Sales and % Total Sales to reflect what I want?


