- Power BI forums
- Updates
- News & Announcements
- Get Help with Power BI
- Desktop
- Service
- Report Server
- Power Query
- Mobile Apps
- Developer
- DAX Commands and Tips
- Custom Visuals Development Discussion
- Health and Life Sciences
- Power BI Spanish forums
- Translated Spanish Desktop
- Power Platform Integration - Better Together!
- Power Platform Integrations (Read-only)
- Power Platform and Dynamics 365 Integrations (Read-only)
- Training and Consulting
- Instructor Led Training
- Dashboard in a Day for Women, by Women
- Galleries
- Community Connections & How-To Videos
- COVID-19 Data Stories Gallery
- Themes Gallery
- Data Stories Gallery
- R Script Showcase
- Webinars and Video Gallery
- Quick Measures Gallery
- 2021 MSBizAppsSummit Gallery
- 2020 MSBizAppsSummit Gallery
- 2019 MSBizAppsSummit Gallery
- Events
- Ideas
- Custom Visuals Ideas
- Issues
- Issues
- Events
- Upcoming Events
- Community Blog
- Power BI Community Blog
- Custom Visuals Community Blog
- Community Support
- Community Accounts & Registration
- Using the Community
- Community Feedback
Register now to learn Fabric in free live sessions led by the best Microsoft experts. From Apr 16 to May 9, in English and Spanish.
- Power BI forums
- Forums
- Get Help with Power BI
- Desktop
- 2 or more information in the horizontal axis.
- Subscribe to RSS Feed
- Mark Topic as New
- Mark Topic as Read
- Float this Topic for Current User
- Bookmark
- Subscribe
- Printer Friendly Page
- Mark as New
- Bookmark
- Subscribe
- Mute
- Subscribe to RSS Feed
- Permalink
- Report Inappropriate Content
2 or more information in the horizontal axis.
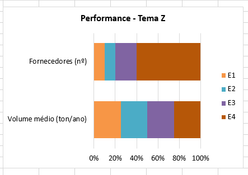
Hi! Maybe it's a very stupid question, but I'd like to know if it's possible to have a chart like this:
Basically I'd like to reply this information in Power BI, but I'm not managing to have in the same chart 2 different y-axis. Is that possible?
Cheers.
Solved! Go to Solution.
- Mark as New
- Bookmark
- Subscribe
- Mute
- Subscribe to RSS Feed
- Permalink
- Report Inappropriate Content
Hi @jujacobowiski,
you need a transformation with current data format to fit the legend and Axis of chart:
Create new table:
Transform Data = UNION( SUMMARIZE(Table1,Table1[Desempenho - Tema 10],Table1[Label 1],"Label","Forneceores") ,SUMMARIZE(Table1,Table1[Desempenho - Tema 10],Table1[Label 2],"Label","Volume medio (ton/ano)") )
If this works for you please accept it as solution and also like to give KUDOS.
Best regards
Tri Nguyen
- Mark as New
- Bookmark
- Subscribe
- Mute
- Subscribe to RSS Feed
- Permalink
- Report Inappropriate Content
Hi @jujacobowiski,
I think yes, it's 100% Stacked bar chart:
And you dont need to calculate percentage, your data is amount (number value)
- Mark as New
- Bookmark
- Subscribe
- Mute
- Subscribe to RSS Feed
- Permalink
- Report Inappropriate Content
I have this data here:
But then when I try to plot Label 1 and Label 2 in like a 100% stacked bar chart, I just can put one value, like here:
I'm sure I'm doing something wrong, but if I replicate what you did and put some value in "axies", it doesn't show me what I wanna see. In my mind I should be able to put Label 1 and Label 2 in "values", so it would appear one below another like in the first pic I sent.
- Mark as New
- Bookmark
- Subscribe
- Mute
- Subscribe to RSS Feed
- Permalink
- Report Inappropriate Content
Ha!
I managed to do it, I had to invert my data, putting E1 - E2 - E3 - E4 like rows instead of collumns. Thank you very much!
- Mark as New
- Bookmark
- Subscribe
- Mute
- Subscribe to RSS Feed
- Permalink
- Report Inappropriate Content
Hi @jujacobowiski,
you need a transformation with current data format to fit the legend and Axis of chart:
Create new table:
Transform Data = UNION( SUMMARIZE(Table1,Table1[Desempenho - Tema 10],Table1[Label 1],"Label","Forneceores") ,SUMMARIZE(Table1,Table1[Desempenho - Tema 10],Table1[Label 2],"Label","Volume medio (ton/ano)") )
If this works for you please accept it as solution and also like to give KUDOS.
Best regards
Tri Nguyen
- Mark as New
- Bookmark
- Subscribe
- Mute
- Subscribe to RSS Feed
- Permalink
- Report Inappropriate Content
Nice!
I did it but manually, good to know there is other way to do! Thank you very much!
- Mark as New
- Bookmark
- Subscribe
- Mute
- Subscribe to RSS Feed
- Permalink
- Report Inappropriate Content
Hi @jujacobowiski,
i'm sorry about my curiousity, but could you please explain the meaning of Fornecedores, Volume ano and Tema Z ? Cause it's not english words so i could not understand behind meaning ^_^
- Mark as New
- Bookmark
- Subscribe
- Mute
- Subscribe to RSS Feed
- Permalink
- Report Inappropriate Content
Of course! haha
Fornecedores = suppliers; Volume = the total amount which was produced. I think it's also written volume in English. And tema is "Issue". Issue Z it's just a general name, could be A, B, C, 1, 2...
Thanks for the helping btw! It was very appreciate, especially because I just started in this Power BI life. :9
Helpful resources

Microsoft Fabric Learn Together
Covering the world! 9:00-10:30 AM Sydney, 4:00-5:30 PM CET (Paris/Berlin), 7:00-8:30 PM Mexico City

Power BI Monthly Update - April 2024
Check out the April 2024 Power BI update to learn about new features.

| User | Count |
|---|---|
| 114 | |
| 99 | |
| 82 | |
| 70 | |
| 60 |
| User | Count |
|---|---|
| 149 | |
| 114 | |
| 107 | |
| 89 | |
| 67 |


