- Power BI forums
- Updates
- News & Announcements
- Get Help with Power BI
- Desktop
- Service
- Report Server
- Power Query
- Mobile Apps
- Developer
- DAX Commands and Tips
- Custom Visuals Development Discussion
- Health and Life Sciences
- Power BI Spanish forums
- Translated Spanish Desktop
- Power Platform Integration - Better Together!
- Power Platform Integrations (Read-only)
- Power Platform and Dynamics 365 Integrations (Read-only)
- Training and Consulting
- Instructor Led Training
- Dashboard in a Day for Women, by Women
- Galleries
- Community Connections & How-To Videos
- COVID-19 Data Stories Gallery
- Themes Gallery
- Data Stories Gallery
- R Script Showcase
- Webinars and Video Gallery
- Quick Measures Gallery
- 2021 MSBizAppsSummit Gallery
- 2020 MSBizAppsSummit Gallery
- 2019 MSBizAppsSummit Gallery
- Events
- Ideas
- Custom Visuals Ideas
- Issues
- Issues
- Events
- Upcoming Events
- Community Blog
- Power BI Community Blog
- Custom Visuals Community Blog
- Community Support
- Community Accounts & Registration
- Using the Community
- Community Feedback
Register now to learn Fabric in free live sessions led by the best Microsoft experts. From Apr 16 to May 9, in English and Spanish.
- Power BI forums
- Forums
- Get Help with Power BI
- Desktop
- 12 month moving average against a measure
- Subscribe to RSS Feed
- Mark Topic as New
- Mark Topic as Read
- Float this Topic for Current User
- Bookmark
- Subscribe
- Printer Friendly Page
- Mark as New
- Bookmark
- Subscribe
- Mute
- Subscribe to RSS Feed
- Permalink
- Report Inappropriate Content
12 month moving average against a measure
Hey all,
Noob back again.
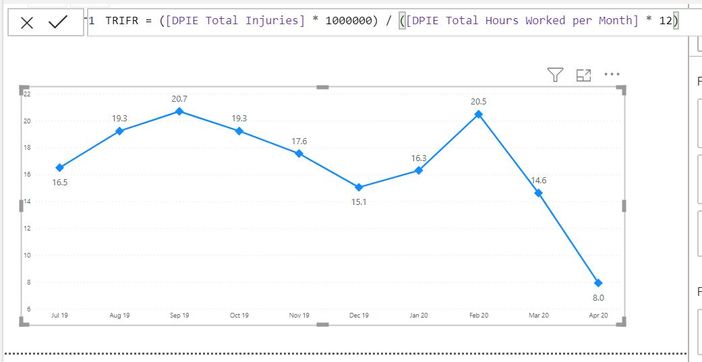
I am trying to create a chart to show 12 month rolling average for a measure that calculates the frequency of injuries occurred for every million hours worked. At the moment I am stuck on how to acheive this as I can only get it to display the value for each month.
Here is what I am doing..
Solved! Go to Solution.
- Mark as New
- Bookmark
- Subscribe
- Mute
- Subscribe to RSS Feed
- Permalink
- Report Inappropriate Content
Hi @Anonymous ,
Would you please try to use quick measure in power bi desktop? It will automatically create measures for you after you set correct options for it like the screenshot below:
For more details, please refer to https://docs.microsoft.com/en-us/power-bi/desktop-quick-measures
Best Regards,
Dedmon Dai
- Mark as New
- Bookmark
- Subscribe
- Mute
- Subscribe to RSS Feed
- Permalink
- Report Inappropriate Content
@Anonymous ,
You can use formula like
Rolling 12 = CALCULATE(sum(Sales[Sales Amount]),DATESINPERIOD(Table[Date],ENDOFMONTH(Sales[Sales Date]),-12,MONTH)) /12
Rolling 12 = CALCULATE(sum(Sales[Sales Amount]),DATESINPERIOD(Table[Date Filer],MAX(Sales[Sales Date]),-12,MONTH)) /12
OR
Rolling 12 = CALCULATE(Average(Sales[Sales Amount]),DATESINPERIOD(Table[Date],ENDOFMONTH(Sales[Sales Date]),-12,MONTH))
Rolling 12 = CALCULATE(Average(Sales[Sales Amount]),DATESINPERIOD(Table[Date Filer],MAX(Sales[Sales Date]),-12,MONTH))
To get the best of the time intelligence function. Make sure you have a date calendar and it has been marked as the date in model view. Also, join it with the date column of your fact/s. Refer :
https://radacad.com/creating-calendar-table-in-power-bi-using-dax-functions
https://www.archerpoint.com/blog/Posts/creating-date-table-power-bi
https://www.sqlbi.com/articles/creating-a-simple-date-table-in-dax/
Microsoft Power BI Learning Resources, 2023 !!
Learn Power BI - Full Course with Dec-2022, with Window, Index, Offset, 100+ Topics !!
Did I answer your question? Mark my post as a solution! Appreciate your Kudos !! Proud to be a Super User! !!
Helpful resources

Microsoft Fabric Learn Together
Covering the world! 9:00-10:30 AM Sydney, 4:00-5:30 PM CET (Paris/Berlin), 7:00-8:30 PM Mexico City

Power BI Monthly Update - April 2024
Check out the April 2024 Power BI update to learn about new features.

| User | Count |
|---|---|
| 109 | |
| 99 | |
| 77 | |
| 66 | |
| 54 |
| User | Count |
|---|---|
| 144 | |
| 104 | |
| 102 | |
| 87 | |
| 64 |


