- Power BI forums
- Updates
- News & Announcements
- Get Help with Power BI
- Desktop
- Service
- Report Server
- Power Query
- Mobile Apps
- Developer
- DAX Commands and Tips
- Custom Visuals Development Discussion
- Health and Life Sciences
- Power BI Spanish forums
- Translated Spanish Desktop
- Power Platform Integration - Better Together!
- Power Platform Integrations (Read-only)
- Power Platform and Dynamics 365 Integrations (Read-only)
- Training and Consulting
- Instructor Led Training
- Dashboard in a Day for Women, by Women
- Galleries
- Community Connections & How-To Videos
- COVID-19 Data Stories Gallery
- Themes Gallery
- Data Stories Gallery
- R Script Showcase
- Webinars and Video Gallery
- Quick Measures Gallery
- 2021 MSBizAppsSummit Gallery
- 2020 MSBizAppsSummit Gallery
- 2019 MSBizAppsSummit Gallery
- Events
- Ideas
- Custom Visuals Ideas
- Issues
- Issues
- Events
- Upcoming Events
- Community Blog
- Power BI Community Blog
- Custom Visuals Community Blog
- Community Support
- Community Accounts & Registration
- Using the Community
- Community Feedback
Register now to learn Fabric in free live sessions led by the best Microsoft experts. From Apr 16 to May 9, in English and Spanish.
- Power BI forums
- Galleries
- Data Stories Gallery
- Re: Vehicle Showroom Dynamics Based on IoT Device
Re: Vehicle Showroom Dynamics Based on IoT Device
10-25-2018 10:04 AM


- Mark as New
- Bookmark
- Subscribe
- Mute
- Subscribe to RSS Feed
- Permalink
- Report Inappropriate Content
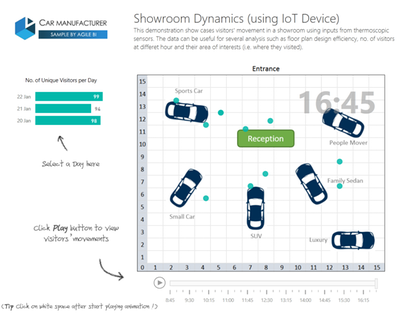
Vehicle Showroom Dynamics Based on IoT Device
This Power BI solution* show cases ability to visualize visitor's movement inside a vehicle showroom using input from IoT device (i.e. Thermoscopic Sensor) .
With this Power BI solution, the leading vehicle manufacturer is capable of "visualizing" their visitors' interests, how they interact with vehicle models and quantify them by "popularity". Insights drawn from such analysis help realise hidden sales opportunity.
This solution also integrates data from cross-platform sources (CRM, Finance and thrid-party data) to build a centralized reporting and analytics platform, both for access through Power BI as well as the Power BI mobile app on the go.

eyJrIjoiNDgxZGYwODUtYWM5NC00NTI5LWI2MmUtMGJhY2Y0NTRmZDRkIiwidCI6IjU3NGMzZTU2LTQ5MjQtNDAwNC1hZDFhLWQ4NDI3ZTdkYjI0MSIsImMiOjZ9
- Mark as New
- Bookmark
- Subscribe
- Mute
- Subscribe to RSS Feed
- Permalink
- Report Inappropriate Content
Hi,
Would you Please share the power bi file ?
- Mark as New
- Bookmark
- Subscribe
- Mute
- Subscribe to RSS Feed
- Permalink
- Report Inappropriate Content
Could you share us the .pbix ?
Also which visuals have you used to accomplish the playback and the axis mapping ?
Regards
- Mark as New
- Bookmark
- Subscribe
- Mute
- Subscribe to RSS Feed
- Permalink
- Report Inappropriate Content
This demo is aweome !!!