- Power BI forums
- Updates
- News & Announcements
- Get Help with Power BI
- Desktop
- Service
- Report Server
- Power Query
- Mobile Apps
- Developer
- DAX Commands and Tips
- Custom Visuals Development Discussion
- Health and Life Sciences
- Power BI Spanish forums
- Translated Spanish Desktop
- Power Platform Integration - Better Together!
- Power Platform Integrations (Read-only)
- Power Platform and Dynamics 365 Integrations (Read-only)
- Training and Consulting
- Instructor Led Training
- Dashboard in a Day for Women, by Women
- Galleries
- Community Connections & How-To Videos
- COVID-19 Data Stories Gallery
- Themes Gallery
- Data Stories Gallery
- R Script Showcase
- Webinars and Video Gallery
- Quick Measures Gallery
- 2021 MSBizAppsSummit Gallery
- 2020 MSBizAppsSummit Gallery
- 2019 MSBizAppsSummit Gallery
- Events
- Ideas
- Custom Visuals Ideas
- Issues
- Issues
- Events
- Upcoming Events
- Community Blog
- Power BI Community Blog
- Custom Visuals Community Blog
- Community Support
- Community Accounts & Registration
- Using the Community
- Community Feedback
Register now to learn Fabric in free live sessions led by the best Microsoft experts. From Apr 16 to May 9, in English and Spanish.
- Power BI forums
- Galleries
- Data Stories Gallery
- Re: Tracking medal count at the Rio 2016 Olympics
Re: Tracking medal count at the Rio 2016 Olympics
08-10-2016 12:18 PM


- Mark as New
- Bookmark
- Subscribe
- Mute
- Subscribe to RSS Feed
- Permalink
- Report Inappropriate Content
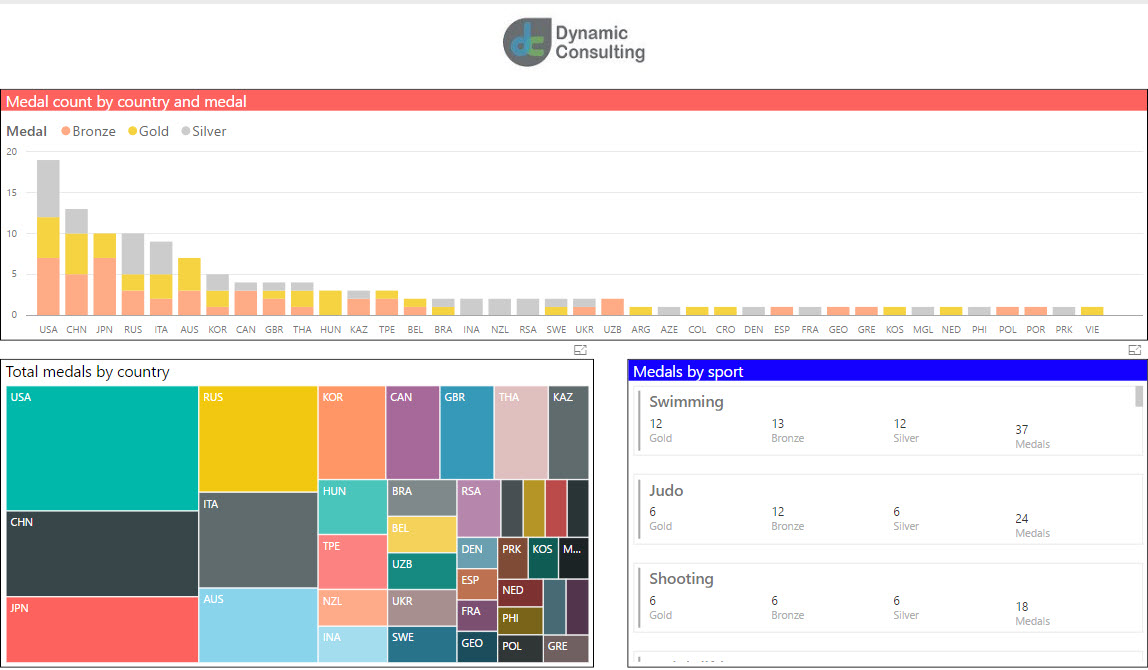
Tracking medal count at the Rio 2016 Olympics
In order to keep track of the performance of the most elite athletes in the world at the Rio 2016 Summer Olympics, I created a Power BI report using data found at www.rio2016.com.
This report was really simple and straightforward. First, I had to look around for places supplying the data in an easy to ingest table-based format. I found this at https://www.rio2016.com/en/medal-count-sports. This particular table had all the information I needed to track each medal by country by event.
I used the "Web" data source in Power BI. Connecting to this dataset brough in individual tables for each of the events. First thing I did was append all of them together into a single table. After doing this, and cleaning out the competitors name (I only wanted the countries), I had what I needed.
Next, I needed to unpivot the columns to get the data into a format I was comfortable with. I wanted a row for each medal at each event, but the data set had each event in a single row. Unpivoting the table got the data how I wanted it. There were some multiple entries in the bronze categories (for ties), so I needed to split that column by the tab delimiter and clean it up to resolve that issue.
Next, I created a couple of new columns to represent the numbers I wanted to use in my visualizations - one each for bronze, silver, gold, and total medal count. The rest was history.
eyJrIjoiMmVmNzBjZTktMjUyYy00OGFjLWJhMzAtNmM4YzNhOTVmMGM5IiwidCI6IjEzZjU3MGNkLTQ3YTctNDBmMC05MDkzLTc3MjcwNDVmODBjYSIsImMiOjN9
- Mark as New
- Bookmark
- Subscribe
- Mute
- Subscribe to RSS Feed
- Permalink
- Report Inappropriate Content
- Mark as New
- Bookmark
- Subscribe
- Mute
- Subscribe to RSS Feed
- Permalink
- Report Inappropriate Content
Thanks @MatherC,
I'm glad you like it and it's cool to see suggestions from the community! There's some things that could certainly be improved still (the ties for gold and silver in swimming aren't probably being calculated - I only handled the ties in Bronze) but I think it's a pretty fun use of Power BI.