- Power BI forums
- Updates
- News & Announcements
- Get Help with Power BI
- Desktop
- Service
- Report Server
- Power Query
- Mobile Apps
- Developer
- DAX Commands and Tips
- Custom Visuals Development Discussion
- Health and Life Sciences
- Power BI Spanish forums
- Translated Spanish Desktop
- Power Platform Integration - Better Together!
- Power Platform Integrations (Read-only)
- Power Platform and Dynamics 365 Integrations (Read-only)
- Training and Consulting
- Instructor Led Training
- Dashboard in a Day for Women, by Women
- Galleries
- Community Connections & How-To Videos
- COVID-19 Data Stories Gallery
- Themes Gallery
- Data Stories Gallery
- R Script Showcase
- Webinars and Video Gallery
- Quick Measures Gallery
- 2021 MSBizAppsSummit Gallery
- 2020 MSBizAppsSummit Gallery
- 2019 MSBizAppsSummit Gallery
- Events
- Ideas
- Custom Visuals Ideas
- Issues
- Issues
- Events
- Upcoming Events
- Community Blog
- Power BI Community Blog
- Custom Visuals Community Blog
- Community Support
- Community Accounts & Registration
- Using the Community
- Community Feedback
Register now to learn Fabric in free live sessions led by the best Microsoft experts. From Apr 16 to May 9, in English and Spanish.
- Power BI forums
- Galleries
- Data Stories Gallery
- The Financial Visuals Reference – Management Repor...
The Financial Visuals Reference – Management Reporting in Power BI
03-14-2019 08:08 AM


- Mark as New
- Bookmark
- Subscribe
- Mute
- Subscribe to RSS Feed
- Permalink
- Report Inappropriate Content
The Financial Visuals Reference – Management Reporting in Power BI
In the Past there were no standards in Reporting at all which lead to sometimes horrible and unreadable Reports with a lot of 3D-, Pie-, Gauge Charts and no meaningful colors as well. Some time ago the IBCS was introduced and set some standards especially for the finance and controlling area. We can discuss about every single design point here, it does not really matter in the end. Important is to follow the general concepts and rules. Create a standard which fits for your organization’s needs, follows best practice and make sure it will be consequently used.
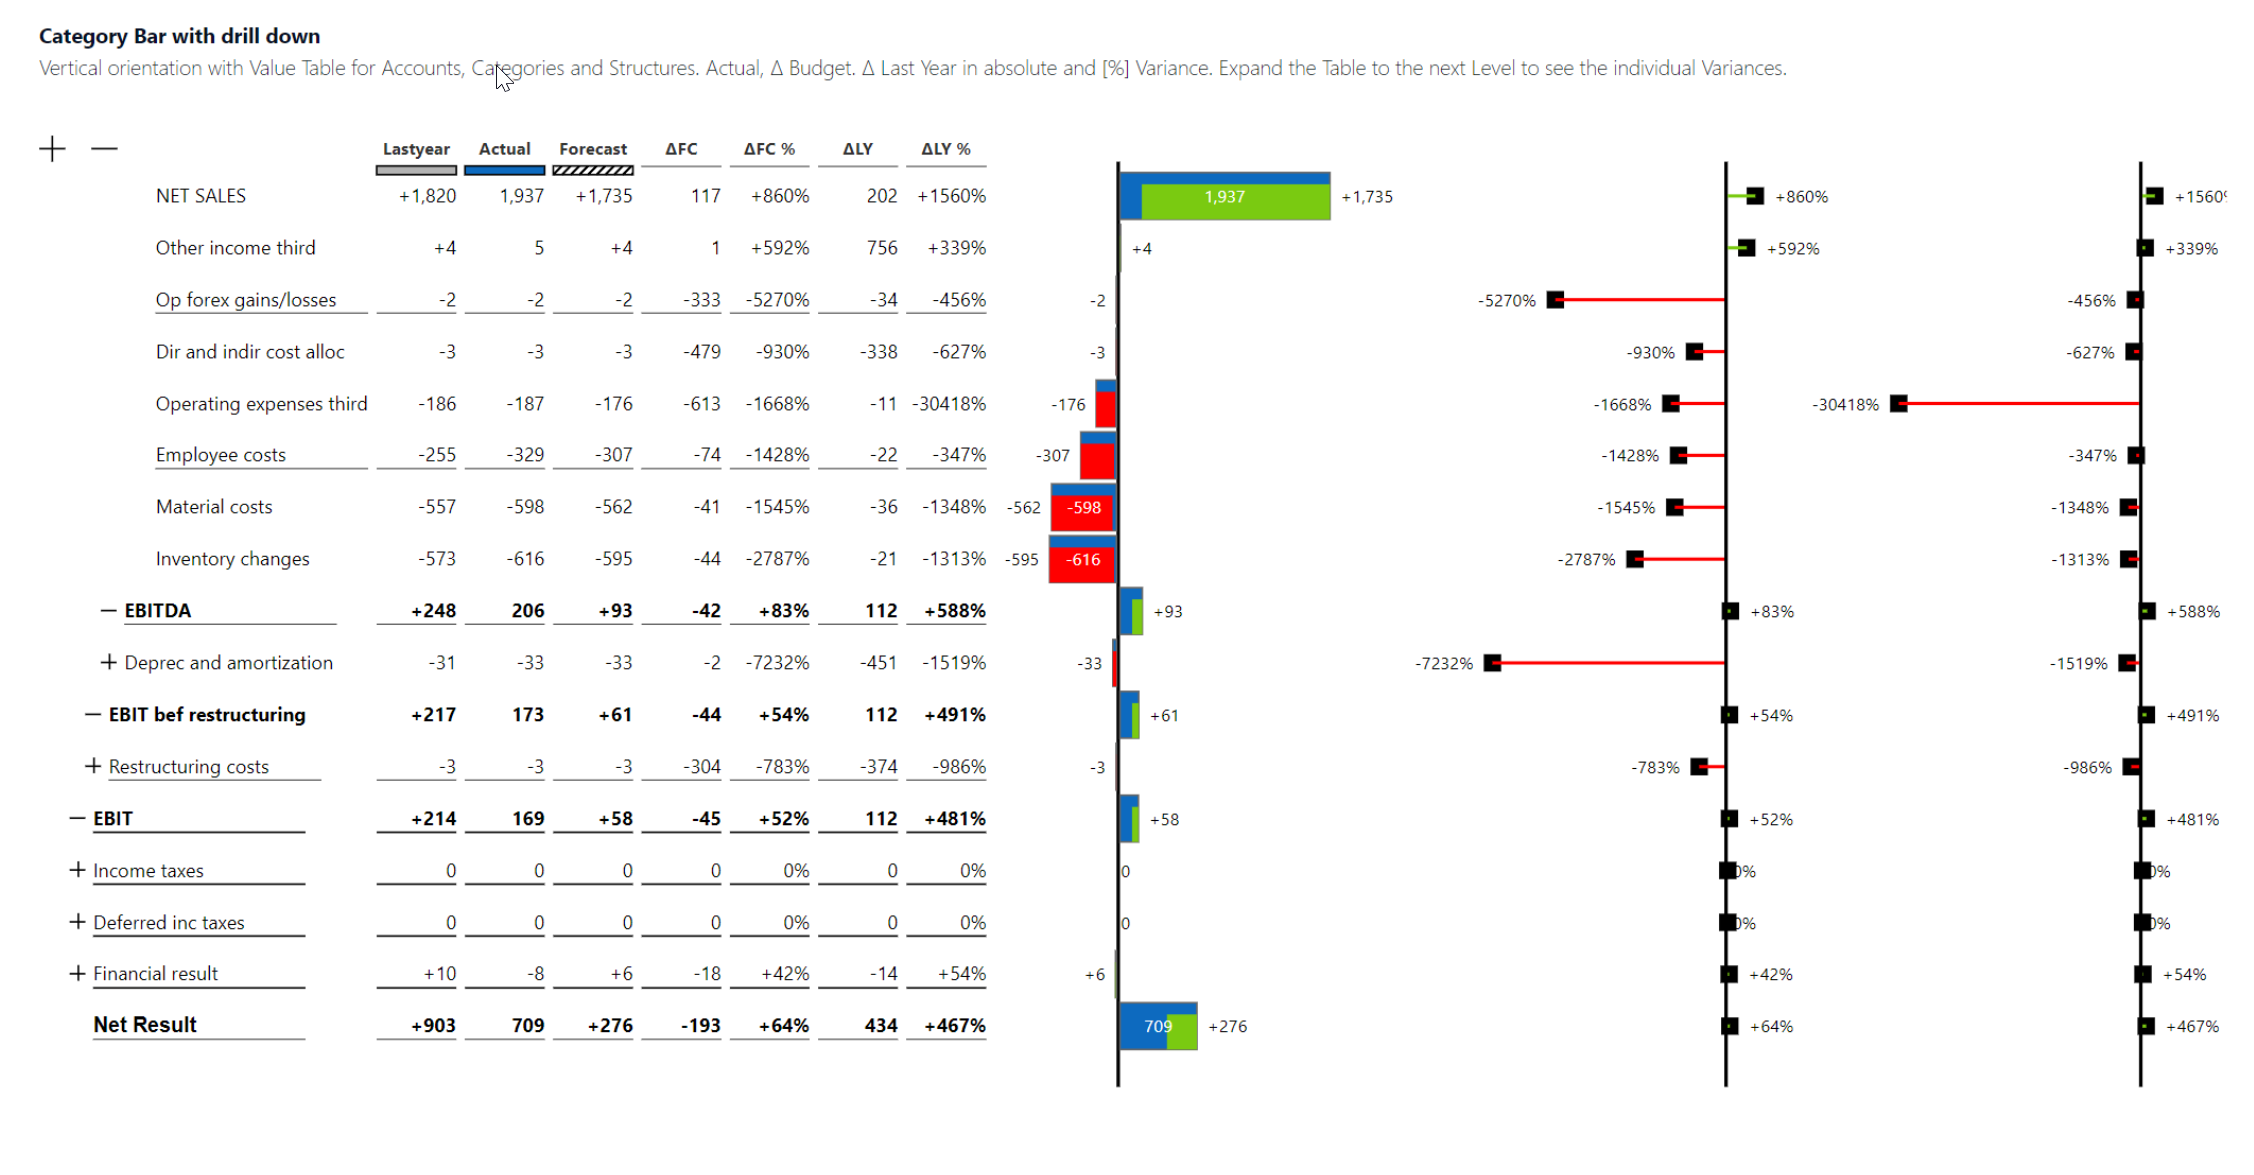
I created the first Draft of “The Financial Visuals Reference - Management Reporting in Power BI”. In this initial Version, I want to focus on KPI Cards which can show the status of a measure by comparing key indicators to a target and/or previous year. Then we go through some methods to show absolute values like Revenue or Costs, percent values like Margins and Variances, Human Resource KPIs like FTE's ( Full Time Equivalents) and Headcounts. Contributions like a Profit and Loss Statement. Comparisons for Gain and Loss of Customers or Revenue versus Costs. Last but not least the concept of small multiples in Management Reporting. We can discuss about every single design point here, it does not really matter in the end. Important is to follow the general concepts and rules. Colours are up to somebody’s preference, they should have just a meaning. Create a standard which fits for your organization’s needs, follows best practice and make sure it will be consequently used.
Klaus Birringer
Please note that I used RAND() Function to generate dummy values heavily. So Charts look always different on reload / refresh. If you see a ugly chart, just reload the page.
eyJrIjoiMGJkY2M0NDEtZjY0NC00NWM5LTk3YjYtOTU2ZDk0YTI3ZmJhIiwidCI6IjJlYmI3YTRhLTk2YTYtNDVhYy1hNWFmLTdjOWQ5NjUyMGFjYiIsImMiOjh9
- Mark as New
- Bookmark
- Subscribe
- Mute
- Subscribe to RSS Feed
- Permalink
- Report Inappropriate Content
Hi
can you share the Pbix file for this?
olziich36@gmail.com
- Mark as New
- Bookmark
- Subscribe
- Mute
- Subscribe to RSS Feed
- Permalink
- Report Inappropriate Content
Hello
https://appsource.microsoft.com/en/marketplace/apps?search=ultimate&product=power-bi-visuals
you can download the sample pbix files from above Link / visuals. it is basically the same.
HTH
Klaus
- Mark as New
- Bookmark
- Subscribe
- Mute
- Subscribe to RSS Feed
- Permalink
- Report Inappropriate Content
Hi
can you share the Pbix file for this?