- Power BI forums
- Updates
- News & Announcements
- Get Help with Power BI
- Desktop
- Service
- Report Server
- Power Query
- Mobile Apps
- Developer
- DAX Commands and Tips
- Custom Visuals Development Discussion
- Health and Life Sciences
- Power BI Spanish forums
- Translated Spanish Desktop
- Power Platform Integration - Better Together!
- Power Platform Integrations (Read-only)
- Power Platform and Dynamics 365 Integrations (Read-only)
- Training and Consulting
- Instructor Led Training
- Dashboard in a Day for Women, by Women
- Galleries
- Community Connections & How-To Videos
- COVID-19 Data Stories Gallery
- Themes Gallery
- Data Stories Gallery
- R Script Showcase
- Webinars and Video Gallery
- Quick Measures Gallery
- 2021 MSBizAppsSummit Gallery
- 2020 MSBizAppsSummit Gallery
- 2019 MSBizAppsSummit Gallery
- Events
- Ideas
- Custom Visuals Ideas
- Issues
- Issues
- Events
- Upcoming Events
- Community Blog
- Power BI Community Blog
- Custom Visuals Community Blog
- Community Support
- Community Accounts & Registration
- Using the Community
- Community Feedback
Register now to learn Fabric in free live sessions led by the best Microsoft experts. From Apr 16 to May 9, in English and Spanish.
- Power BI forums
- Galleries
- Data Stories Gallery
- Statistics Finland’s Open Data by Postal Code
Statistics Finland’s Open Data by Postal Code
03-25-2017 09:28 AM


- Mark as New
- Bookmark
- Subscribe
- Mute
- Subscribe to RSS Feed
- Permalink
- Report Inappropriate Content
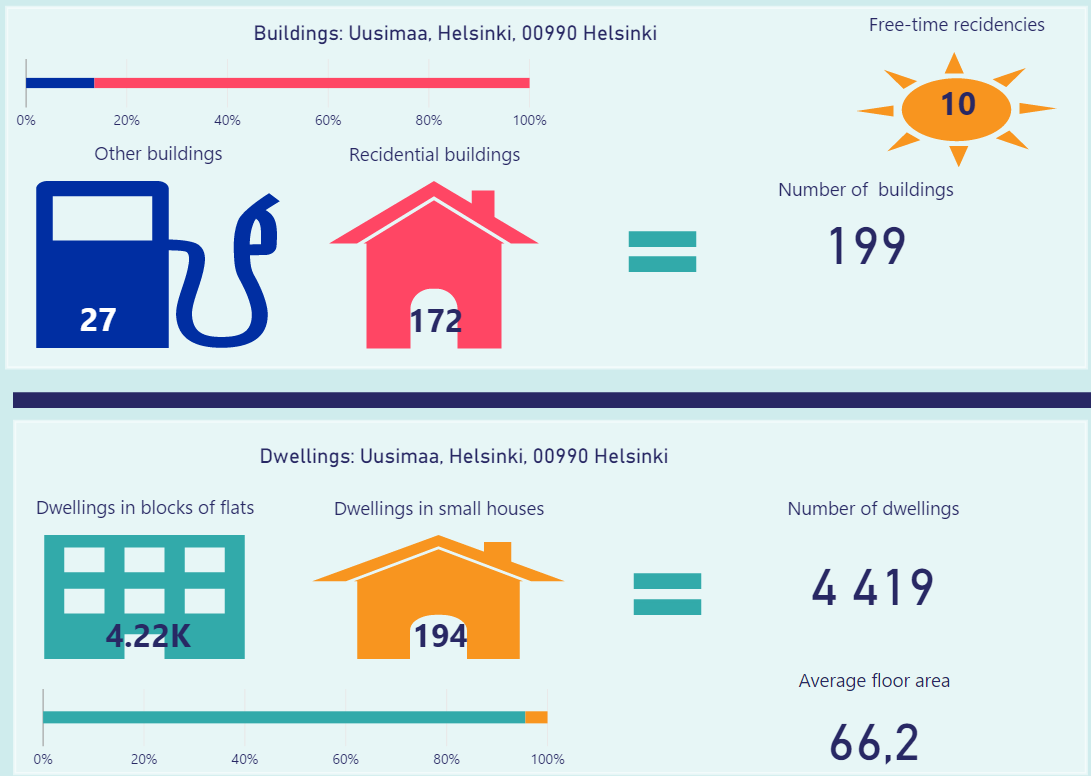
Statistics Finland’s Open Data by Postal Code
This Power BI visualization includes all Statistics Finland's data sets from the PAAVO statistical database. There are also a few key figures from wikipedia.
Data sets published by Statistics Finland in January 2017:
Population structure (2015), Educational structure (2014), Inhabitants' disposable monetary income (2014), Size and stage in life of households (2015), Households' disposable monetary income (2014), Buildings and dwellings (2015), Workplace structure (2014), Main type of activity (2014).
Because the source data is already summarized and grouped, it's not possible to conclude for example the age groups by gender or by education. That's why these visualizations are not as interactive as Power BI reports usually are. Average and median values are reported on the postal address level in the source data and you need to choose that level to see those values.
Statistics Finland's data sets are loaded with M scripts generated by Q4OpenData tool.
Originally published: http://vilahdus.fi/statistics-finlands-open-data-by-postal-address-visualized/
eyJrIjoiYTE0NTJmNDYtZDZlOC00YWY4LTg1NWMtNWU2ZGMyN2I3ZjE4IiwidCI6ImNjYjg3NjAyLTgyYmYtNGYzNS1iN2QyLTgxM2U3MmEzNTRlMCIsImMiOjh9