- Power BI forums
- Updates
- News & Announcements
- Get Help with Power BI
- Desktop
- Service
- Report Server
- Power Query
- Mobile Apps
- Developer
- DAX Commands and Tips
- Custom Visuals Development Discussion
- Health and Life Sciences
- Power BI Spanish forums
- Translated Spanish Desktop
- Power Platform Integration - Better Together!
- Power Platform Integrations (Read-only)
- Power Platform and Dynamics 365 Integrations (Read-only)
- Training and Consulting
- Instructor Led Training
- Dashboard in a Day for Women, by Women
- Galleries
- Community Connections & How-To Videos
- COVID-19 Data Stories Gallery
- Themes Gallery
- Data Stories Gallery
- R Script Showcase
- Webinars and Video Gallery
- Quick Measures Gallery
- 2021 MSBizAppsSummit Gallery
- 2020 MSBizAppsSummit Gallery
- 2019 MSBizAppsSummit Gallery
- Events
- Ideas
- Custom Visuals Ideas
- Issues
- Issues
- Events
- Upcoming Events
- Community Blog
- Power BI Community Blog
- Custom Visuals Community Blog
- Community Support
- Community Accounts & Registration
- Using the Community
- Community Feedback
Register now to learn Fabric in free live sessions led by the best Microsoft experts. From Apr 16 to May 9, in English and Spanish.
- Power BI forums
- Galleries
- Data Stories Gallery
- Spotify's Power 2017 Rankings!
Spotify's Power 2017 Rankings!
01-31-2018 20:59 PM - last edited 10-22-2018 02:35 AM


- Mark as New
- Bookmark
- Subscribe
- Mute
- Subscribe to RSS Feed
- Permalink
- Report Inappropriate Content
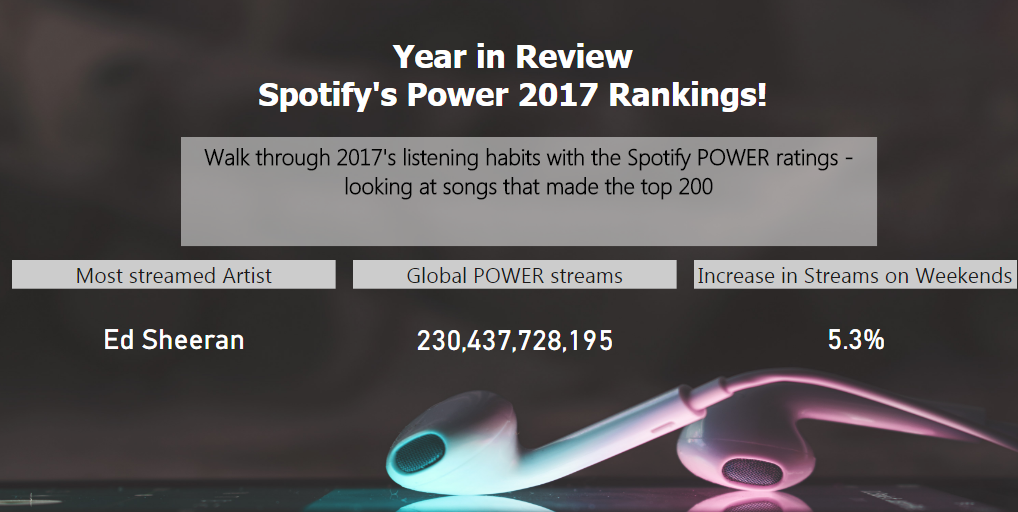
Spotify's Power 2017 Rankings!
A year in review - oh how we danced!
This report looks at the daily top 200 songs treamed on Spotify, over almost 60 countries that Spotify thinks is worthy of including in their charts. We focus on the top streamed songs and the heaviest hitting artists, telling a story with fun visuals.
All streaming data is scraped from :
https://spotifycharts.com/regional/global/daily/latest
Features of each song were pulled from the Spotify API:
https://developer.spotify.com/web-api/
Additionally, we have some fun indexes:
The Heat index!
Looks at the daily average temperature, as reporteded by
ftp://ftp.ncdc.noaa.gov/pub/data/ghcn/daily/by_year/
The Wage index!
The average wage index of a songs streamers by country, OECD data available from data.world
DataWorld.Dataset("oecd", "wage-levels")
Scraped Data:
https://www.dropbox.com/s/t6lhg4tfrxshxlx/Data.zip?dl=0
Attached PBIX has disabled some data load to model for space saving.
eyJrIjoiMzJmMDgwYjEtYTAwNy00YWYxLTgzYTEtMzBkYzk0M2MzZGU3IiwidCI6IjhmNzlmMTgzLWU3YjUtNDUwOS1hMmY0LTg1Y2I1MDIyMDllMCIsImMiOjN9
Did I answer your question? Mark my post as a solution! Proud to be a Super User!
Connect with me!
Stay up to date on
Read my blogs on