- Power BI forums
- Updates
- News & Announcements
- Get Help with Power BI
- Desktop
- Service
- Report Server
- Power Query
- Mobile Apps
- Developer
- DAX Commands and Tips
- Custom Visuals Development Discussion
- Health and Life Sciences
- Power BI Spanish forums
- Translated Spanish Desktop
- Power Platform Integration - Better Together!
- Power Platform Integrations (Read-only)
- Power Platform and Dynamics 365 Integrations (Read-only)
- Training and Consulting
- Instructor Led Training
- Dashboard in a Day for Women, by Women
- Galleries
- Community Connections & How-To Videos
- COVID-19 Data Stories Gallery
- Themes Gallery
- Data Stories Gallery
- R Script Showcase
- Webinars and Video Gallery
- Quick Measures Gallery
- 2021 MSBizAppsSummit Gallery
- 2020 MSBizAppsSummit Gallery
- 2019 MSBizAppsSummit Gallery
- Events
- Ideas
- Custom Visuals Ideas
- Issues
- Issues
- Events
- Upcoming Events
- Community Blog
- Power BI Community Blog
- Custom Visuals Community Blog
- Community Support
- Community Accounts & Registration
- Using the Community
- Community Feedback
Register now to learn Fabric in free live sessions led by the best Microsoft experts. From Apr 16 to May 9, in English and Spanish.
- Power BI forums
- Galleries
- Data Stories Gallery
- Quality of Life, Cost of Living and Happiness arou...
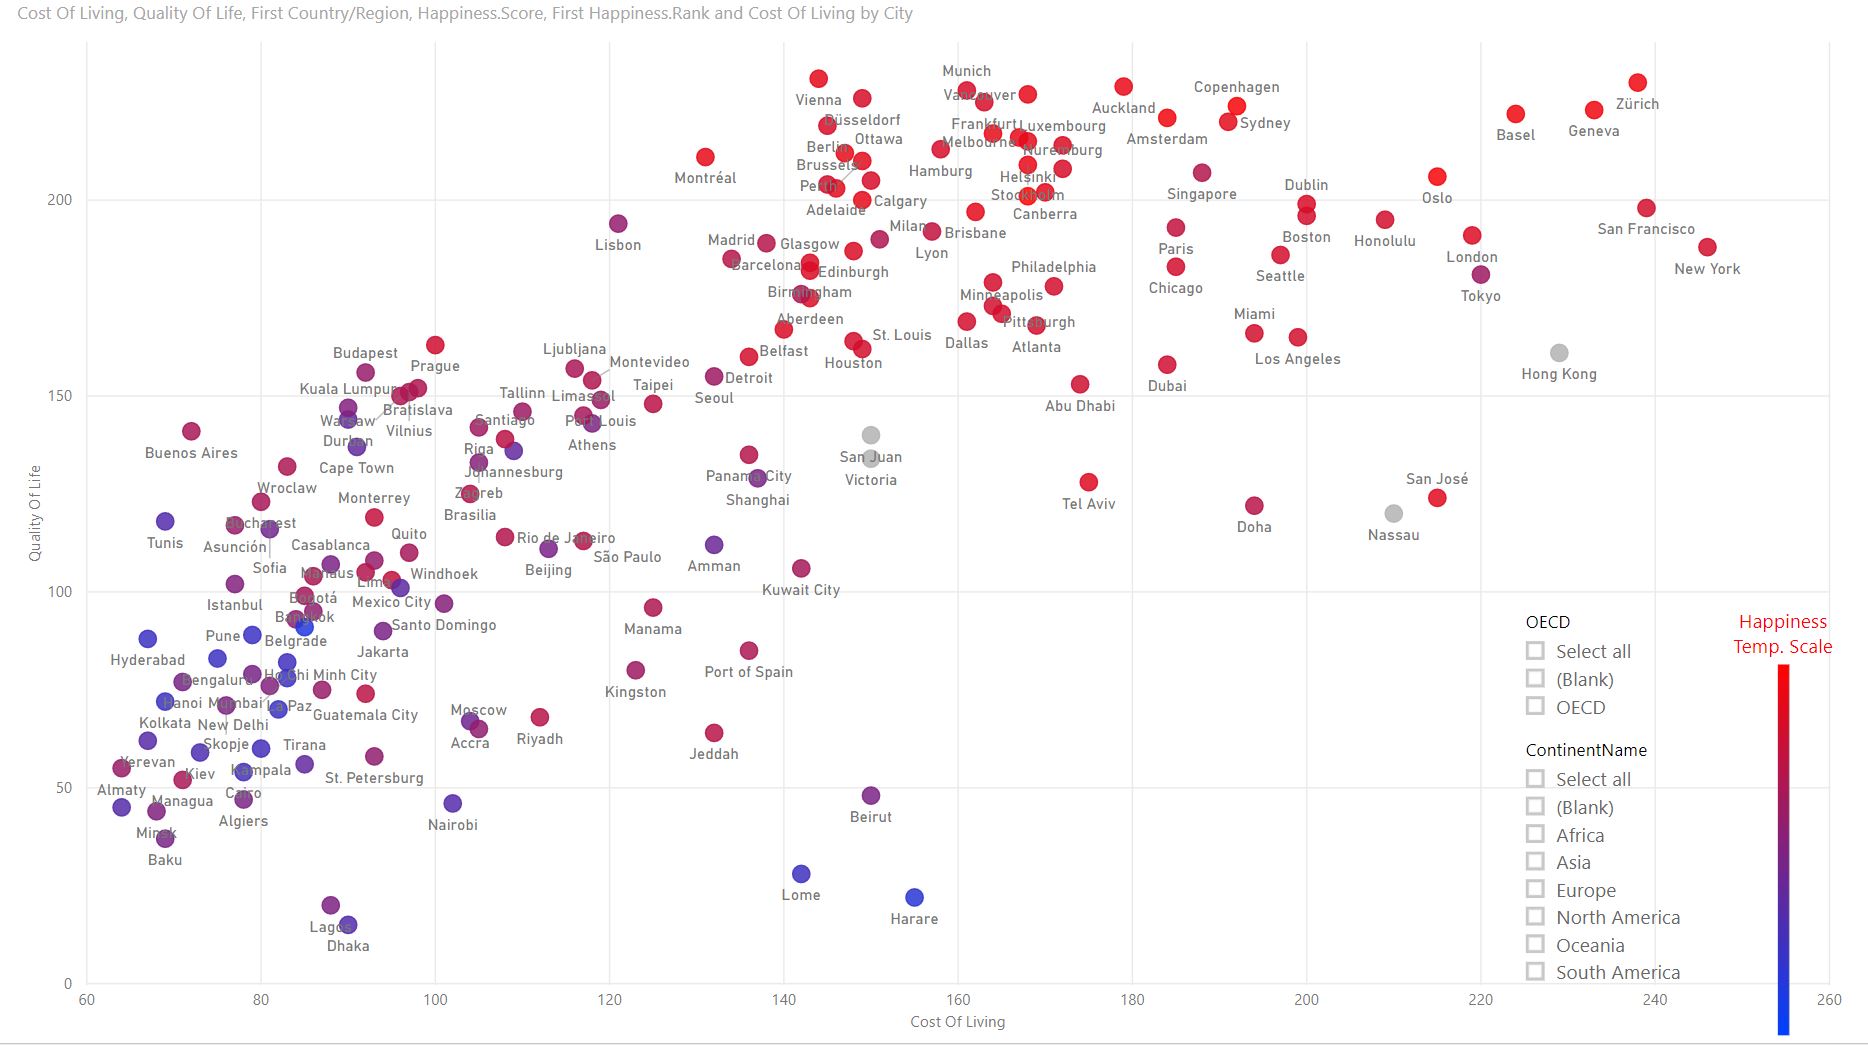
Quality of Life, Cost of Living and Happiness around the World
06-17-2019 11:37 AM - last edited 06-17-2019 11:41 AM


- Mark as New
- Bookmark
- Subscribe
- Mute
- Subscribe to RSS Feed
- Permalink
- Report Inappropriate Content
Quality of Life, Cost of Living and Happiness around the World
Hi All,
I leveraged the idea and used the link below as a reference to build this model, and I also used the same data sources that were mentioned over there:
In addition to this, I added the 2019 Happiness index as a temperature color code from the 2019 World Happiness Report from over here:
https://worldhappiness.report/ed/2019/
There are 2 pages in the story: one has happiness as the temperature and the other one has the cost of living.
The model is attached and I can also share the source tables if anyone's interested - just let me know.
Best regards,
Vladimir
eyJrIjoiNWQxNDZiY2UtNDM2Zi00YWNiLWFlY2QtYjBmOWUwNDk2MzEwIiwidCI6ImUxMzk1OWFkLTYyNzktNDIwYy1hYmEzLWE5ZTgzYzg1YWQyZSIsImMiOjh9