- Power BI forums
- Updates
- News & Announcements
- Get Help with Power BI
- Desktop
- Service
- Report Server
- Power Query
- Mobile Apps
- Developer
- DAX Commands and Tips
- Custom Visuals Development Discussion
- Health and Life Sciences
- Power BI Spanish forums
- Translated Spanish Desktop
- Power Platform Integration - Better Together!
- Power Platform Integrations (Read-only)
- Power Platform and Dynamics 365 Integrations (Read-only)
- Training and Consulting
- Instructor Led Training
- Dashboard in a Day for Women, by Women
- Galleries
- Community Connections & How-To Videos
- COVID-19 Data Stories Gallery
- Themes Gallery
- Data Stories Gallery
- R Script Showcase
- Webinars and Video Gallery
- Quick Measures Gallery
- 2021 MSBizAppsSummit Gallery
- 2020 MSBizAppsSummit Gallery
- 2019 MSBizAppsSummit Gallery
- Events
- Ideas
- Custom Visuals Ideas
- Issues
- Issues
- Events
- Upcoming Events
- Community Blog
- Power BI Community Blog
- Custom Visuals Community Blog
- Community Support
- Community Accounts & Registration
- Using the Community
- Community Feedback
Register now to learn Fabric in free live sessions led by the best Microsoft experts. From Apr 16 to May 9, in English and Spanish.
- Power BI forums
- Galleries
- Data Stories Gallery
- Re: Power BI Pokedex
Re: Power BI Pokedex
09-17-2019 07:26 AM - last edited 09-17-2019 07:34 AM


- Mark as New
- Bookmark
- Subscribe
- Mute
- Subscribe to RSS Feed
- Permalink
- Report Inappropriate Content
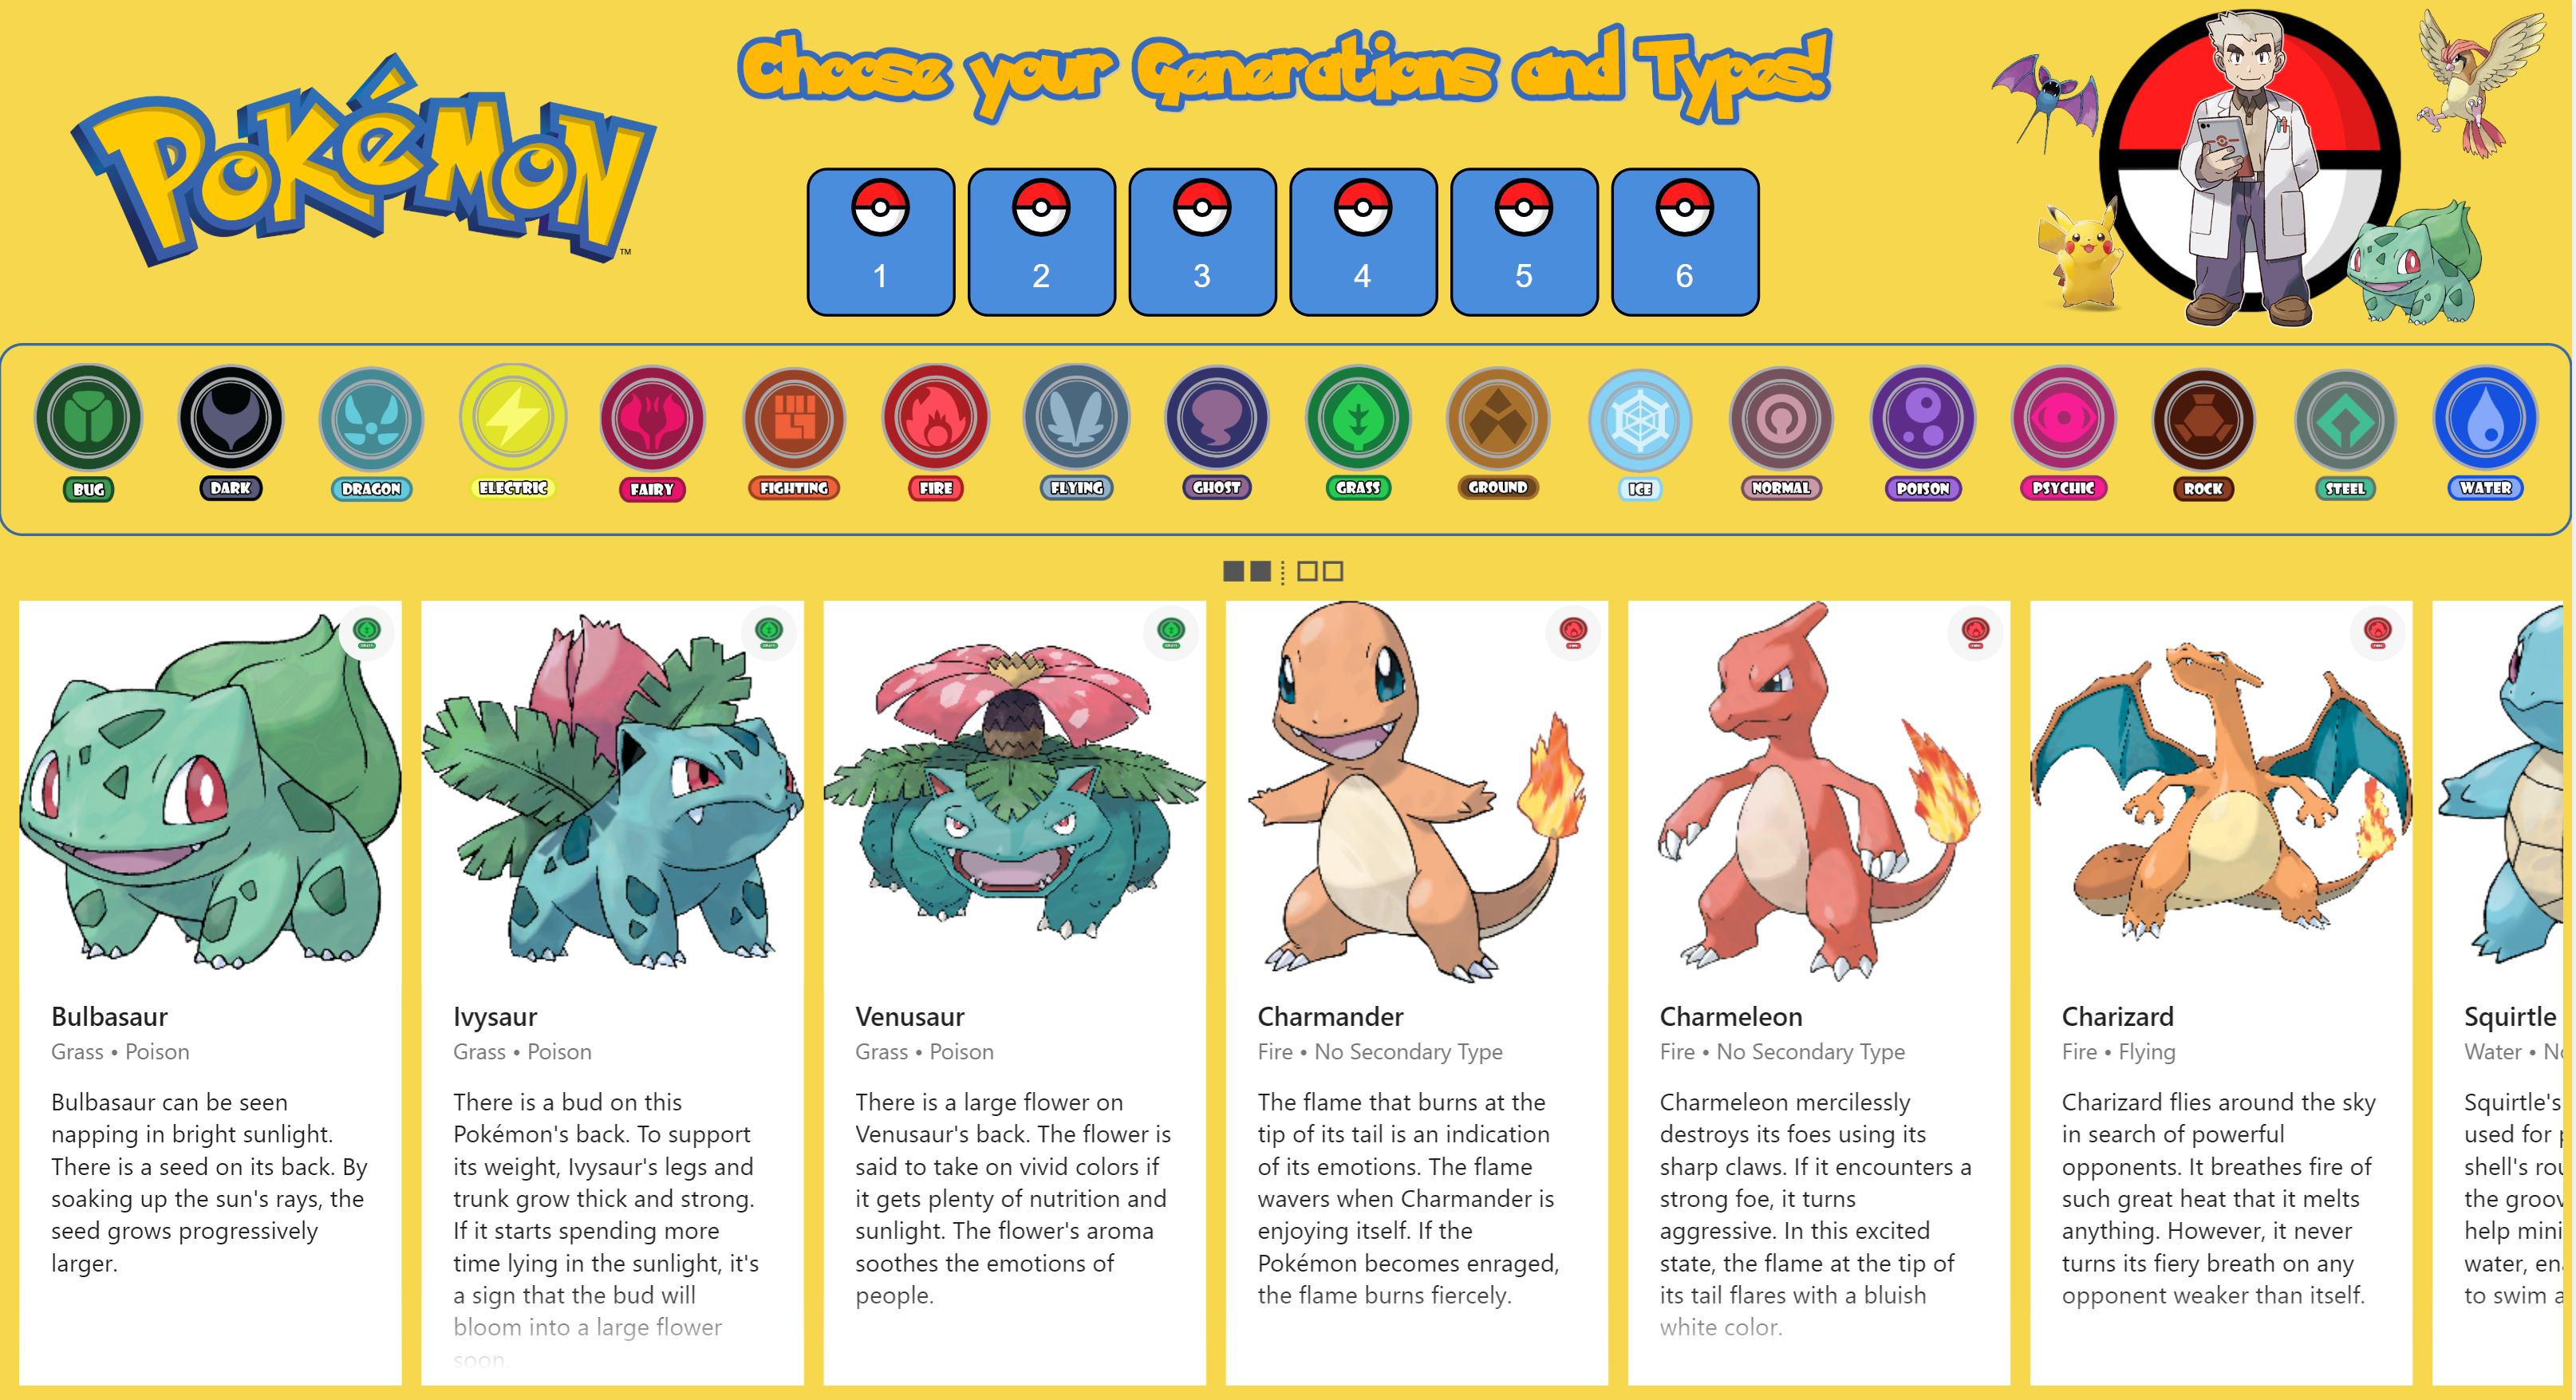
Power BI Pokedex
Do you want to be the best like no one ever was? Then take a look at my Power BI Pokedex. Utilising the wide variety of visualisations available in Power BI I have created a set of Pokemon cards for generations 1 to 6. The report is filterable by generation and type. The cards are scrollable and can can be expanded to view the individual Pokemon's stats. All the information a budding Pokemon Master could need!
Pokemon images & stats sourced from kaggle data sets
Pokemon descriptions sourced from Pokemon.com
eyJrIjoiOTJhNmZmNjktOTZmMS00MGVhLTk4YzUtMjdkNDVlYzEwZTIwIiwidCI6ImU3M2I4M2Q5LTgzNjUtNDBiYy1hYWZhLTI3YzA4NDZhNjQ0ZiIsImMiOjh9
- Mark as New
- Bookmark
- Subscribe
- Mute
- Subscribe to RSS Feed
- Permalink
- Report Inappropriate Content
Would you be able to pass your image source to me? I'm doing something similar, and would like to use the same images if possible.
- Mark as New
- Bookmark
- Subscribe
- Mute
- Subscribe to RSS Feed
- Permalink
- Report Inappropriate Content
it looks great! great job
- Mark as New
- Bookmark
- Subscribe
- Mute
- Subscribe to RSS Feed
- Permalink
- Report Inappropriate Content
Hi!
Your dashboard is very impressive, great work!
can you tell me the visualizations you've used?
i liked very much the pokemon slicer and its expand option.
Best regards,
Max
- Mark as New
- Bookmark
- Subscribe
- Mute
- Subscribe to RSS Feed
- Permalink
- Report Inappropriate Content
Hi.
Thanks very much. I enjoyed making this one. The cards themselves are the Card Browser viz, the Types slicer uses the Image Grid, & the Type slicer is the Chiclet Slicer. All are available from the marketplace.
- Mark as New
- Bookmark
- Subscribe
- Mute
- Subscribe to RSS Feed
- Permalink
- Report Inappropriate Content
Looks awesome! Which visual did you use for flipping the stats?