- Power BI forums
- Updates
- News & Announcements
- Get Help with Power BI
- Desktop
- Service
- Report Server
- Power Query
- Mobile Apps
- Developer
- DAX Commands and Tips
- Custom Visuals Development Discussion
- Health and Life Sciences
- Power BI Spanish forums
- Translated Spanish Desktop
- Power Platform Integration - Better Together!
- Power Platform Integrations (Read-only)
- Power Platform and Dynamics 365 Integrations (Read-only)
- Training and Consulting
- Instructor Led Training
- Dashboard in a Day for Women, by Women
- Galleries
- Community Connections & How-To Videos
- COVID-19 Data Stories Gallery
- Themes Gallery
- Data Stories Gallery
- R Script Showcase
- Webinars and Video Gallery
- Quick Measures Gallery
- 2021 MSBizAppsSummit Gallery
- 2020 MSBizAppsSummit Gallery
- 2019 MSBizAppsSummit Gallery
- Events
- Ideas
- Custom Visuals Ideas
- Issues
- Issues
- Events
- Upcoming Events
- Community Blog
- Power BI Community Blog
- Custom Visuals Community Blog
- Community Support
- Community Accounts & Registration
- Using the Community
- Community Feedback
Register now to learn Fabric in free live sessions led by the best Microsoft experts. From Apr 16 to May 9, in English and Spanish.
- Power BI forums
- Galleries
- Data Stories Gallery
- Re: KPI Breakdown Scorecard by Decisive Data
Re: KPI Breakdown Scorecard by Decisive Data
08-13-2022 00:25 AM


- Mark as New
- Bookmark
- Subscribe
- Mute
- Subscribe to RSS Feed
- Permalink
- Report Inappropriate Content
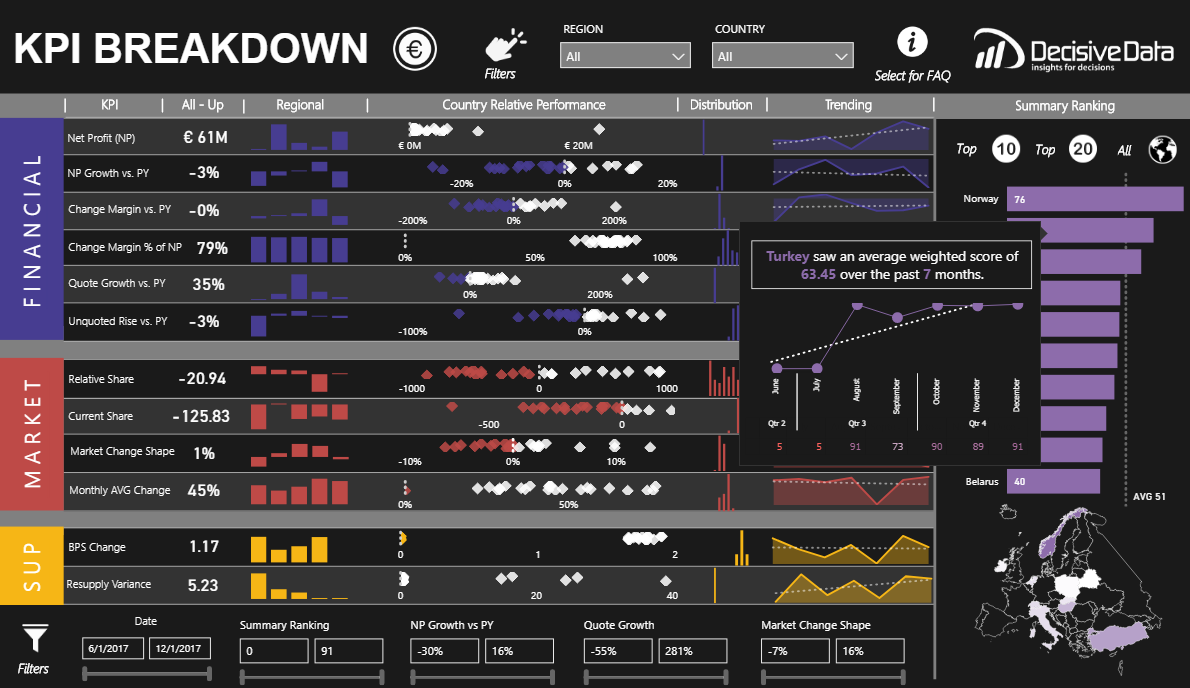
KPI Breakdown Scorecard by Decisive Data
In the words of mighty Julius Caesar, “Divide and conquer”, and data is no different. We can break down any complex problem into buckets which forges a path to purposefully resolve it. In this example, the KPI Breakdown Scorecard looks at a complex global enterprise and boils it down to six summary viewpoints along the top, across 12 KPIs.
Using this dashboard, executives have a macro view on the enterprise's performance across the globe, complete with top performing and underperforming countries. Reducing the time to insight which greatly accelerates the decision making process.
You’ll find a complete overview of this dashboard on our blog that includes;
- Drill down into the different views I used when building this dashboard
- Understanding how you can gain a wholistic understanding of your business using The KPI Breakdown dashboard
- How to tell a data story using design elements such as flow and interactions
- Insight into several new Power BI features
Visit our blog post on the subject!
Jake Olsby


eyJrIjoiNmI4ZWIxMWItNTQyNi00OTM3LWFiYjEtODg2YTI3ZTNiYjkyIiwidCI6IjdlY2M4YWEwLTgzMGUtNGQ4Ni1hZjc4LTgzYTNkY2MyNjIzOCIsImMiOjZ9
- Mark as New
- Bookmark
- Subscribe
- Mute
- Subscribe to RSS Feed
- Permalink
- Report Inappropriate Content
Thank you for sharing the idea.please could you share PBX File my email: yaaqoub971@gmail.com
- Mark as New
- Bookmark
- Subscribe
- Mute
- Subscribe to RSS Feed
- Permalink
- Report Inappropriate Content
Thank you for sharing the idea. Could you please share this with me? My email is vuhiennn@gmail.com
- Mark as New
- Bookmark
- Subscribe
- Mute
- Subscribe to RSS Feed
- Permalink
- Report Inappropriate Content
Hi Can you please PBX File of this on below email id
sayedadilahmed@gamail.com
- Mark as New
- Bookmark
- Subscribe
- Mute
- Subscribe to RSS Feed
- Permalink
- Report Inappropriate Content
The Dash Board is great.
Can you please share the data set and pbix file for the above dash board to pavankumar.vankadara9790@gmail.com
- Mark as New
- Bookmark
- Subscribe
- Mute
- Subscribe to RSS Feed
- Permalink
- Report Inappropriate Content
Hi @jolsby,
Amazing work. I have one question, which visualization you have used for Trending section?
Regrads,
snandy2011