- Power BI forums
- Updates
- News & Announcements
- Get Help with Power BI
- Desktop
- Service
- Report Server
- Power Query
- Mobile Apps
- Developer
- DAX Commands and Tips
- Custom Visuals Development Discussion
- Health and Life Sciences
- Power BI Spanish forums
- Translated Spanish Desktop
- Power Platform Integration - Better Together!
- Power Platform Integrations (Read-only)
- Power Platform and Dynamics 365 Integrations (Read-only)
- Training and Consulting
- Instructor Led Training
- Dashboard in a Day for Women, by Women
- Galleries
- Community Connections & How-To Videos
- COVID-19 Data Stories Gallery
- Themes Gallery
- Data Stories Gallery
- R Script Showcase
- Webinars and Video Gallery
- Quick Measures Gallery
- 2021 MSBizAppsSummit Gallery
- 2020 MSBizAppsSummit Gallery
- 2019 MSBizAppsSummit Gallery
- Events
- Ideas
- Custom Visuals Ideas
- Issues
- Issues
- Events
- Upcoming Events
- Community Blog
- Power BI Community Blog
- Custom Visuals Community Blog
- Community Support
- Community Accounts & Registration
- Using the Community
- Community Feedback
Register now to learn Fabric in free live sessions led by the best Microsoft experts. From Apr 16 to May 9, in English and Spanish.
- Power BI forums
- Galleries
- Data Stories Gallery
- Indian Super League
Indian Super League
02-22-2016 12:19 PM - last edited 06-28-2016 15:34 PM


- Mark as New
- Bookmark
- Subscribe
- Mute
- Subscribe to RSS Feed
- Permalink
- Report Inappropriate Content
Indian Super League
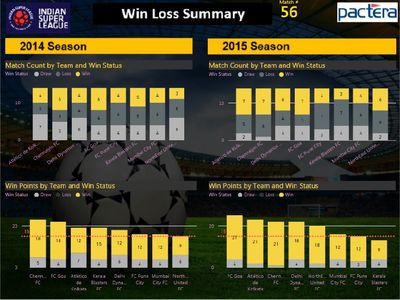
Power BI Desktop and Power BI Online Services were leveraged to create this powerful game analytics dashboard for the Indian Super League (Soccer) team. The exercise involved real time web sourced content from game results for 2014 and 2015 coupled with a series of transformations. Indian Soccer League Fans have grown to record levels since the introduction in 2014. Today, the Indian Soccer League website makes key status available for Goals at an all up level. Additionally, Fans are able to see statistics on favorite players. Yet, fans have limited tools to analyze their favorite teams. By Consuming statistics in real time from the Indian Super League site, we are able to generate Win/Loss and home advantage insights. We can also use the Win Loss Summary tab to analyze which teams are best performing. But Power BI Can do even more. By using the timeline tool, we can see how the teams have progressed over time. At first of the season with just 10 matches under way, it looks like Atletico has the lead. But by mid-way through the season, FC Goa is clearly leading the pack followed by FC Pune. As we approach the current season’s end, match 56, we see the top four teams that made it into the playoffs. In Summary, Power BI delivers robust visualizations and an ease of implementation that made analyzing the Indian Soccer League results a snap!
Learn more about this report from the author by watching this video: https://www.youtube.com/watch?v=aDURDaFaM0I

eyJrIjoiNjAxZjc2MTctNTAyZi00ZmMwLWI0ODAtMmEyZDQxYWJhNTg0IiwidCI6IjU3NGMzZTU2LTQ5MjQtNDAwNC1hZDFhLWQ4NDI3ZTdkYjI0MSIsImMiOjZ9