- Power BI forums
- Updates
- News & Announcements
- Get Help with Power BI
- Desktop
- Service
- Report Server
- Power Query
- Mobile Apps
- Developer
- DAX Commands and Tips
- Custom Visuals Development Discussion
- Health and Life Sciences
- Power BI Spanish forums
- Translated Spanish Desktop
- Power Platform Integration - Better Together!
- Power Platform Integrations (Read-only)
- Power Platform and Dynamics 365 Integrations (Read-only)
- Training and Consulting
- Instructor Led Training
- Dashboard in a Day for Women, by Women
- Galleries
- Community Connections & How-To Videos
- COVID-19 Data Stories Gallery
- Themes Gallery
- Data Stories Gallery
- R Script Showcase
- Webinars and Video Gallery
- Quick Measures Gallery
- 2021 MSBizAppsSummit Gallery
- 2020 MSBizAppsSummit Gallery
- 2019 MSBizAppsSummit Gallery
- Events
- Ideas
- Custom Visuals Ideas
- Issues
- Issues
- Events
- Upcoming Events
- Community Blog
- Power BI Community Blog
- Custom Visuals Community Blog
- Community Support
- Community Accounts & Registration
- Using the Community
- Community Feedback
Register now to learn Fabric in free live sessions led by the best Microsoft experts. From Apr 16 to May 9, in English and Spanish.
- Power BI forums
- Galleries
- Data Stories Gallery
- Re: HubSpot CRM to Power BI (Sales Pipeline Insigh...
Re: HubSpot CRM to Power BI (Sales Pipeline Insights) by BIGINTSolutions.com
06-20-2019 07:00 AM


- Mark as New
- Bookmark
- Subscribe
- Mute
- Subscribe to RSS Feed
- Permalink
- Report Inappropriate Content
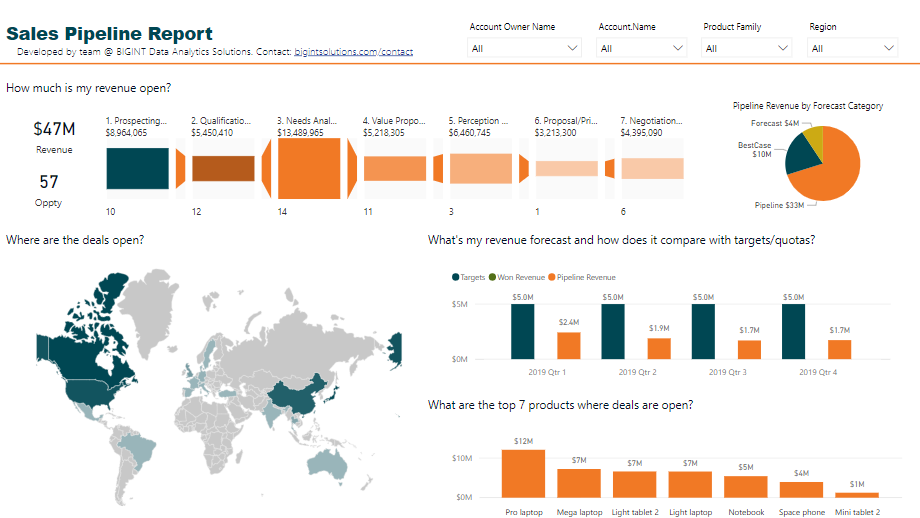
HubSpot CRM to Power BI (Sales Pipeline Insights) by BIGINTSolutions.com
How much revenue is in pipeline?
How are we doing against the quotas/targets?
At what stage are the deals stuck?
Who is the deal owner?
What's my sales cycle?
And much more.
Analyze your HubSpot CRM data using this report developed to showcase Sales Pipeline Insights. The data is pulled using Rest APIs, modeled and visualized in Power BI.
More details on our website with more Report tabs/views. Play live here:
https://bigintsolutions.com/2019/01/17/2-ways-to-copy-data-to-power-bi-from-online-services/
And btw, good news. We now have the most requested custom data connector. Yes, you guessed it right. Custom data connector to HubSpot CRM is available on our GitHub Page.
Feel free to try it out and give feedback.
Head here: https://github.com/ranmax123/powerbi-custom-connectors
Thank you
Ranbeer Makin
ABOUT US:
Website: https://bigintsolutions.com/
Contact us: https://bigintsolutions.com/contact
You’ll find me here:
Linkedin: https://www.linkedin.com/in/ranbeer
Twitter: @ranbeerm
eyJrIjoiYjI2YmMyMDgtNzEzMi00MDkzLWFkZjQtYmY0ZDBlOWQzNDYzIiwidCI6IjE1MTI1NmRmLTcyYmMtNDc0ZS1hMzYwLWFhYjg1NjY3ZmE5MiJ9
- Mark as New
- Bookmark
- Subscribe
- Mute
- Subscribe to RSS Feed
- Permalink
- Report Inappropriate Content
Hey Ranbeer,
What visual have you used for salespipe line please? Looks very nice.
Cheers,
Bhupendra
- Mark as New
- Bookmark
- Subscribe
- Mute
- Subscribe to RSS Feed
- Permalink
- Report Inappropriate Content
It's a custom visual. Horizontal Funnel Chart
- Mark as New
- Bookmark
- Subscribe
- Mute
- Subscribe to RSS Feed
- Permalink
- Report Inappropriate Content
thanks
- Mark as New
- Bookmark
- Subscribe
- Mute
- Subscribe to RSS Feed
- Permalink
- Report Inappropriate Content
Nice!
How do you calulate the win rate?
And what chart did you use for funnel?
Thanks
- Mark as New
- Bookmark
- Subscribe
- Mute
- Subscribe to RSS Feed
- Permalink
- Report Inappropriate Content
Thanks for the feedback @michaelshparber
Win Rate = (total won opptys)/(total closed opptys (won + lost))
The funnel chart is a custom visual -> horizontal funnel chart.
And btw, good news. We now have the most requested custom data connector. Yes, you guessed it right. Custom data connector to HubSpot is available on our GitHub Page.
Head here: https://github.com/ranmax123/powerbi-custom-connectors
-Ranbeer
- Mark as New
- Bookmark
- Subscribe
- Mute
- Subscribe to RSS Feed
- Permalink
- Report Inappropriate Content
hI Which Visual you have used for MAP as background is white which i m looking. Please help me..
@ranbeermakin wrote:
Thanks for the feedback @michaelshparber
Win Rate = (total won opptys)/(total closed opptys (won + lost))
The funnel chart is a custom visual -> horizontal funnel chart.
And btw, good news. We now have the most requested custom data connector. Yes, you guessed it right. Custom data connector to HubSpot is available on our GitHub Page.
Head here: https://github.com/ranmax123/powerbi-custom-connectors
-Ranbeer
- Mark as New
- Bookmark
- Subscribe
- Mute
- Subscribe to RSS Feed
- Permalink
- Report Inappropriate Content
This is a shape map visual with world map GeoJSON file.