- Power BI forums
- Updates
- News & Announcements
- Get Help with Power BI
- Desktop
- Service
- Report Server
- Power Query
- Mobile Apps
- Developer
- DAX Commands and Tips
- Custom Visuals Development Discussion
- Health and Life Sciences
- Power BI Spanish forums
- Translated Spanish Desktop
- Power Platform Integration - Better Together!
- Power Platform Integrations (Read-only)
- Power Platform and Dynamics 365 Integrations (Read-only)
- Training and Consulting
- Instructor Led Training
- Dashboard in a Day for Women, by Women
- Galleries
- Community Connections & How-To Videos
- COVID-19 Data Stories Gallery
- Themes Gallery
- Data Stories Gallery
- R Script Showcase
- Webinars and Video Gallery
- Quick Measures Gallery
- 2021 MSBizAppsSummit Gallery
- 2020 MSBizAppsSummit Gallery
- 2019 MSBizAppsSummit Gallery
- Events
- Ideas
- Custom Visuals Ideas
- Issues
- Issues
- Events
- Upcoming Events
- Community Blog
- Power BI Community Blog
- Custom Visuals Community Blog
- Community Support
- Community Accounts & Registration
- Using the Community
- Community Feedback
Register now to learn Fabric in free live sessions led by the best Microsoft experts. From Apr 16 to May 9, in English and Spanish.
- Power BI forums
- Galleries
- Data Stories Gallery
- FIFA World Cup at a Glance


- Mark as New
- Bookmark
- Subscribe
- Mute
- Subscribe to RSS Feed
- Permalink
- Report Inappropriate Content
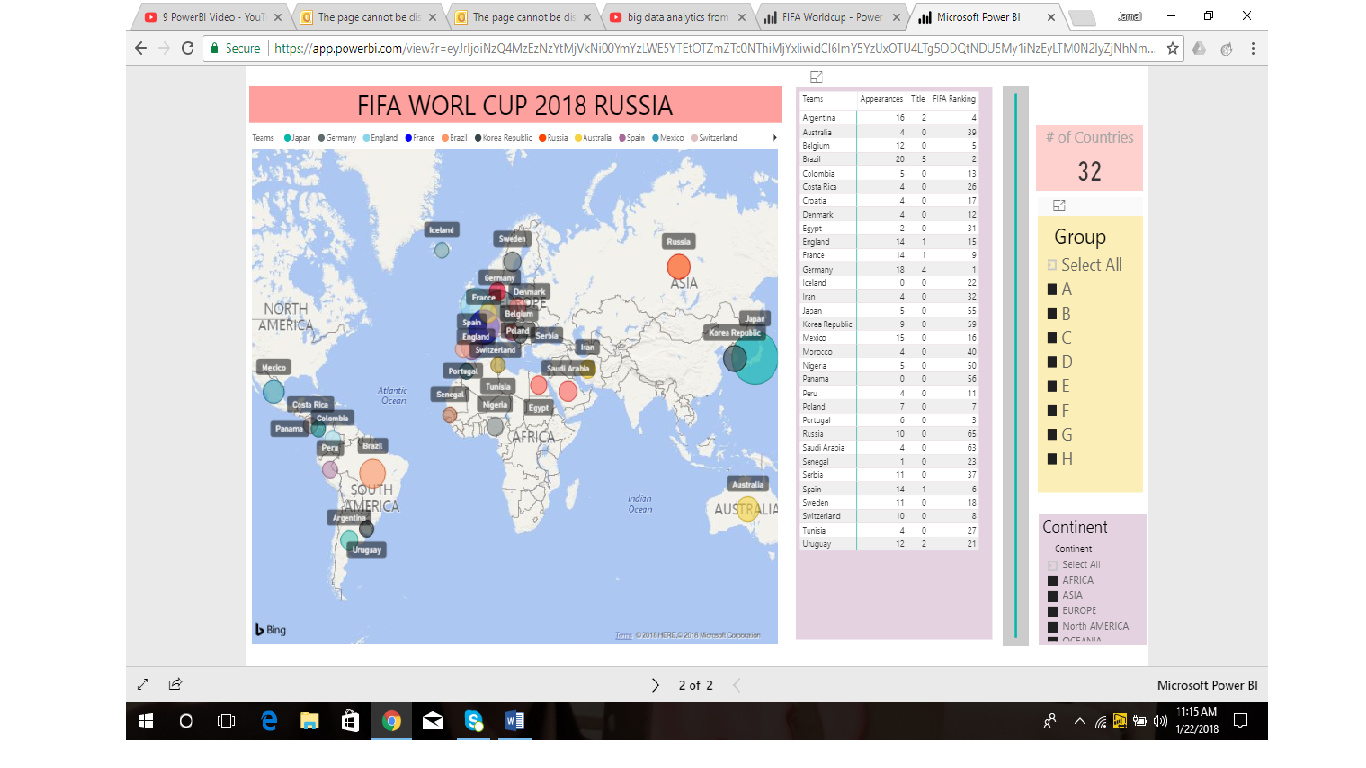
FIFA World Cup at a Glance
FIFA World Cup Russia 2018
Here, I did some brief history analysis of FIFA World Cup. I like soccer a lot due to the reason I have decided to work something on FIFA historical champions and cover team grouping of the coming FIFA World cup “Russia 2018”.
For the historical analysis, I preferred to work on the “Time-line Storyteller”. This is a very strong tool and one can use it with different angle. There are two slides in the timeline storyteller, the 1st one is coving which team won the match in a particular year and which country had hosted the tournament. One can easily use the option of timeline representation, Scale and Layout (which is appearing at the top of the report). You can manage and design the output as per your desired. However the 2nd slide is also showing another way of studying the data.
In the 2nd page, you can see the team grouping, continent wise team numbers, and team appearance in the FIFA world Cup, Team world ranking and number of time they won the title. You can also see the country location in the map which will be definitely useful for the students. In the map, the size of the bubble is based on the GDP of the economy. I am sure that the info will be useful for everyone.
I need your feedback on this Visualization of FIFA World cup. You can contact with me at jamal_qamar@hotmail.com for the pbix file.
Regards,
Jamal Qamar
eyJrIjoiNzQ4MzEzNzYtMjVkNi00YmYzLWE5YTEtOTZmZTc0NThiMjYxIiwidCI6ImY5YzUxOTU4LTg5ODQtNDU5My1iNzEyLTM0N2IyZjNhNmNiYiIsImMiOjl9