- Power BI forums
- Updates
- News & Announcements
- Get Help with Power BI
- Desktop
- Service
- Report Server
- Power Query
- Mobile Apps
- Developer
- DAX Commands and Tips
- Custom Visuals Development Discussion
- Health and Life Sciences
- Power BI Spanish forums
- Translated Spanish Desktop
- Power Platform Integration - Better Together!
- Power Platform Integrations (Read-only)
- Power Platform and Dynamics 365 Integrations (Read-only)
- Training and Consulting
- Instructor Led Training
- Dashboard in a Day for Women, by Women
- Galleries
- Community Connections & How-To Videos
- COVID-19 Data Stories Gallery
- Themes Gallery
- Data Stories Gallery
- R Script Showcase
- Webinars and Video Gallery
- Quick Measures Gallery
- 2021 MSBizAppsSummit Gallery
- 2020 MSBizAppsSummit Gallery
- 2019 MSBizAppsSummit Gallery
- Events
- Ideas
- Custom Visuals Ideas
- Issues
- Issues
- Events
- Upcoming Events
- Community Blog
- Power BI Community Blog
- Custom Visuals Community Blog
- Community Support
- Community Accounts & Registration
- Using the Community
- Community Feedback
Register now to learn Fabric in free live sessions led by the best Microsoft experts. From Apr 16 to May 9, in English and Spanish.
- Power BI forums
- Galleries
- Data Stories Gallery
- Delivery App performance - Warehouse to Store Anal...
Delivery App performance - Warehouse to Store Analysis
07-25-2020 09:30 AM - last edited 07-25-2020 09:35 AM


- Mark as New
- Bookmark
- Subscribe
- Mute
- Subscribe to RSS Feed
- Permalink
- Report Inappropriate Content
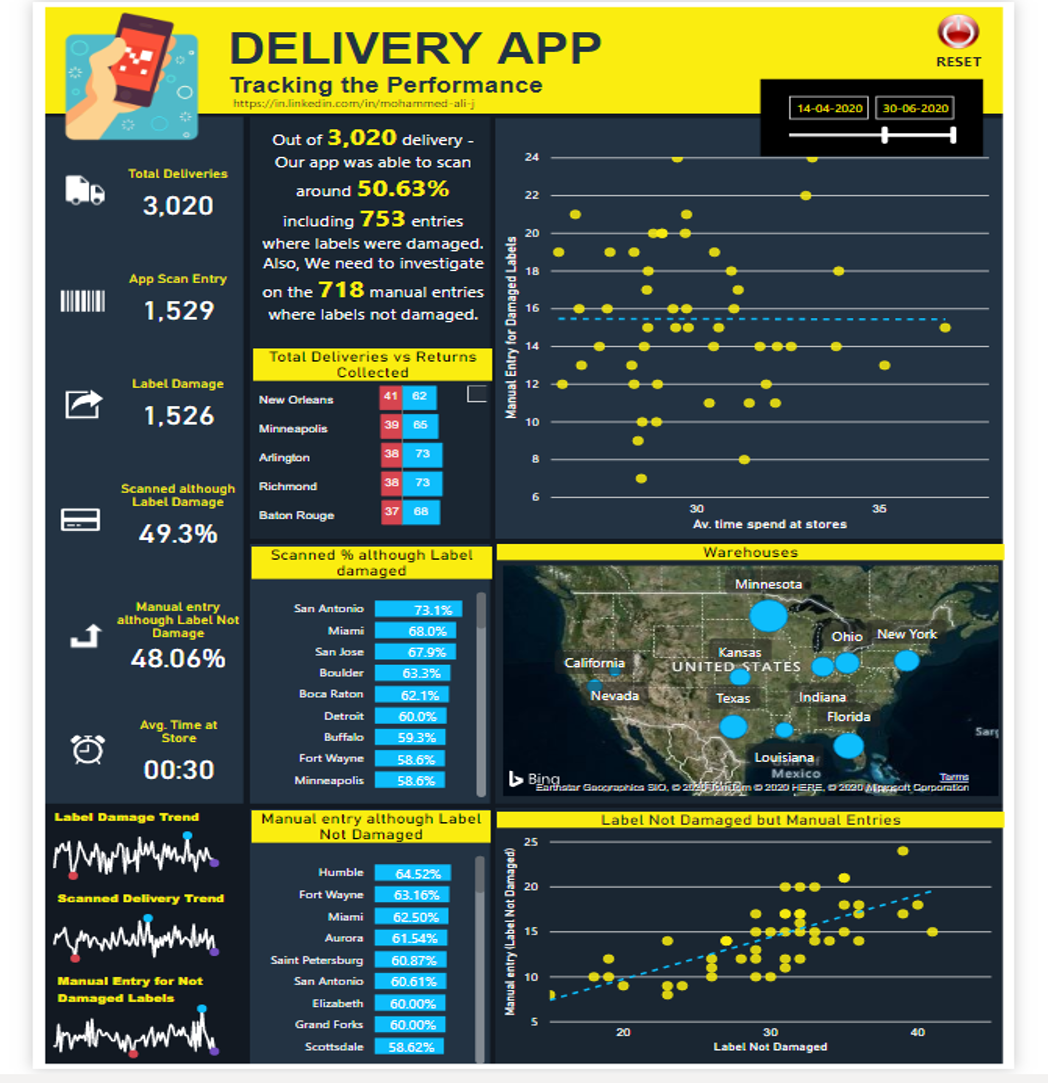
Delivery App performance - Warehouse to Store Analysis
Infographic Inspired Delivery App dashboard to track all the Key Peformance Indicators on a daily basis. This Dashboard to track KPI's like Total Delivery vs Return Delivery, Damaged Labels, avg time spend at the store etc.
Do let me know your views and suggestion on the visualization in the below comments.
Icon source: icon-icons.com
eyJrIjoiN2UzNzEwZDMtMmI2NC00ODlhLTg0ODMtMzhjMmQzZjZmYTRmIiwidCI6IjQ5MzkwMzQ4LTk2ZGMtNDZhZC05YTYyLWMxMDQzMDIwZmQ2MyJ9&pageName=ReportSection1e185c06475991a29ee9