- Power BI forums
- Updates
- News & Announcements
- Get Help with Power BI
- Desktop
- Service
- Report Server
- Power Query
- Mobile Apps
- Developer
- DAX Commands and Tips
- Custom Visuals Development Discussion
- Health and Life Sciences
- Power BI Spanish forums
- Translated Spanish Desktop
- Power Platform Integration - Better Together!
- Power Platform Integrations (Read-only)
- Power Platform and Dynamics 365 Integrations (Read-only)
- Training and Consulting
- Instructor Led Training
- Dashboard in a Day for Women, by Women
- Galleries
- Community Connections & How-To Videos
- COVID-19 Data Stories Gallery
- Themes Gallery
- Data Stories Gallery
- R Script Showcase
- Webinars and Video Gallery
- Quick Measures Gallery
- 2021 MSBizAppsSummit Gallery
- 2020 MSBizAppsSummit Gallery
- 2019 MSBizAppsSummit Gallery
- Events
- Ideas
- Custom Visuals Ideas
- Issues
- Issues
- Events
- Upcoming Events
- Community Blog
- Power BI Community Blog
- Custom Visuals Community Blog
- Community Support
- Community Accounts & Registration
- Using the Community
- Community Feedback
Register now to learn Fabric in free live sessions led by the best Microsoft experts. From Apr 16 to May 9, in English and Spanish.
- Power BI forums
- Galleries
- Data Stories Gallery
- Customer Intelligence Analytics
Customer Intelligence Analytics
09-01-2020 23:01 PM - last edited 09-09-2020 07:58 AM


- Mark as New
- Bookmark
- Subscribe
- Mute
- Subscribe to RSS Feed
- Permalink
- Report Inappropriate Content
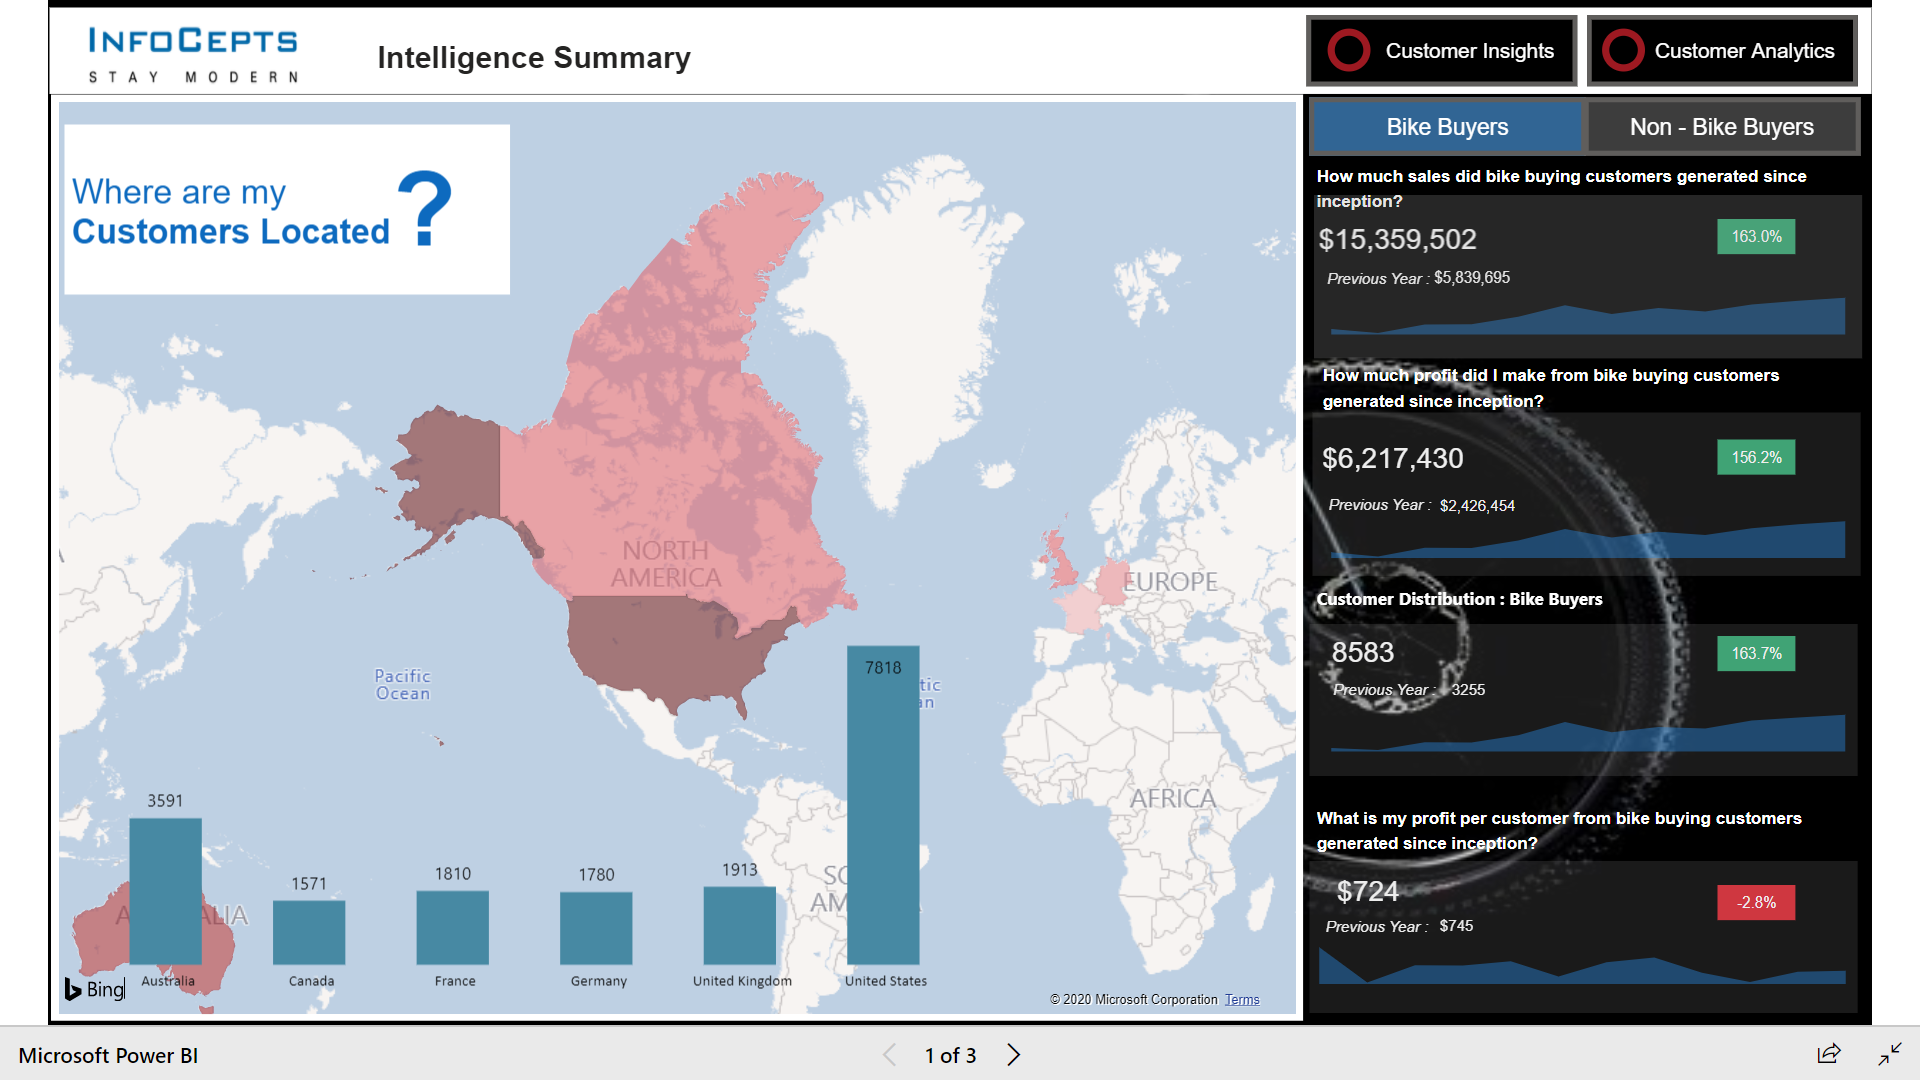
Customer Intelligence Analytics
Customer Intelligence Analytics dashboard provides a comprehensive overlook to the Sales Manager regarding the distribution and buying pattern of his customers across various domains and territories. It focuses on the segregation of products as bikes and non-bikes, which helps to provide a comparative look at the numbers. Knowing the profit per customer helps the company in assessing which customers to target for its marketing strategies in order to boost the revenue. The insight section of the dashboard provides a more detailed look at the customer portfolio. Customers are divided into three categories - Premium, Loyal and Medicare & Economical, based on their income brackets, buying pattern, location, profit per head, etc. Manager can have a look at the key metrics depending on these categories. The analytics section helps identify potential customers and how much profit they can bring into the company. Various demographics are taken into consideration to identify these customers which include occupation, age group, education, gender, etc. It uses a complex machine learning algorithm to identify which non-bike buying customers can be converted into a bike buyer over a certain period. Overall, the dashboard enables manager to be more customer centric in their decision-making process.
eyJrIjoiNTMyMmI2MTYtNGU1YS00MGYxLWJlZDItYzU1YWNhNjU3NTJhIiwidCI6IjA0ZWM2MTA5LTRjNzktNGM3My1hZTcxLWE0NzRjMDlhMWY1YSJ9