- Power BI forums
- Updates
- News & Announcements
- Get Help with Power BI
- Desktop
- Service
- Report Server
- Power Query
- Mobile Apps
- Developer
- DAX Commands and Tips
- Custom Visuals Development Discussion
- Health and Life Sciences
- Power BI Spanish forums
- Translated Spanish Desktop
- Power Platform Integration - Better Together!
- Power Platform Integrations (Read-only)
- Power Platform and Dynamics 365 Integrations (Read-only)
- Training and Consulting
- Instructor Led Training
- Dashboard in a Day for Women, by Women
- Galleries
- Community Connections & How-To Videos
- COVID-19 Data Stories Gallery
- Themes Gallery
- Data Stories Gallery
- R Script Showcase
- Webinars and Video Gallery
- Quick Measures Gallery
- 2021 MSBizAppsSummit Gallery
- 2020 MSBizAppsSummit Gallery
- 2019 MSBizAppsSummit Gallery
- Events
- Ideas
- Custom Visuals Ideas
- Issues
- Issues
- Events
- Upcoming Events
- Community Blog
- Power BI Community Blog
- Custom Visuals Community Blog
- Community Support
- Community Accounts & Registration
- Using the Community
- Community Feedback
Register now to learn Fabric in free live sessions led by the best Microsoft experts. From Apr 16 to May 9, in English and Spanish.
- Power BI forums
- Galleries
- Data Stories Gallery
- Coronavirus Globally Affected v2
Coronavirus Globally Affected v2
04-15-2020 12:14 PM - last edited 04-30-2020 04:01 AM


- Mark as New
- Bookmark
- Subscribe
- Mute
- Subscribe to RSS Feed
- Permalink
- Report Inappropriate Content
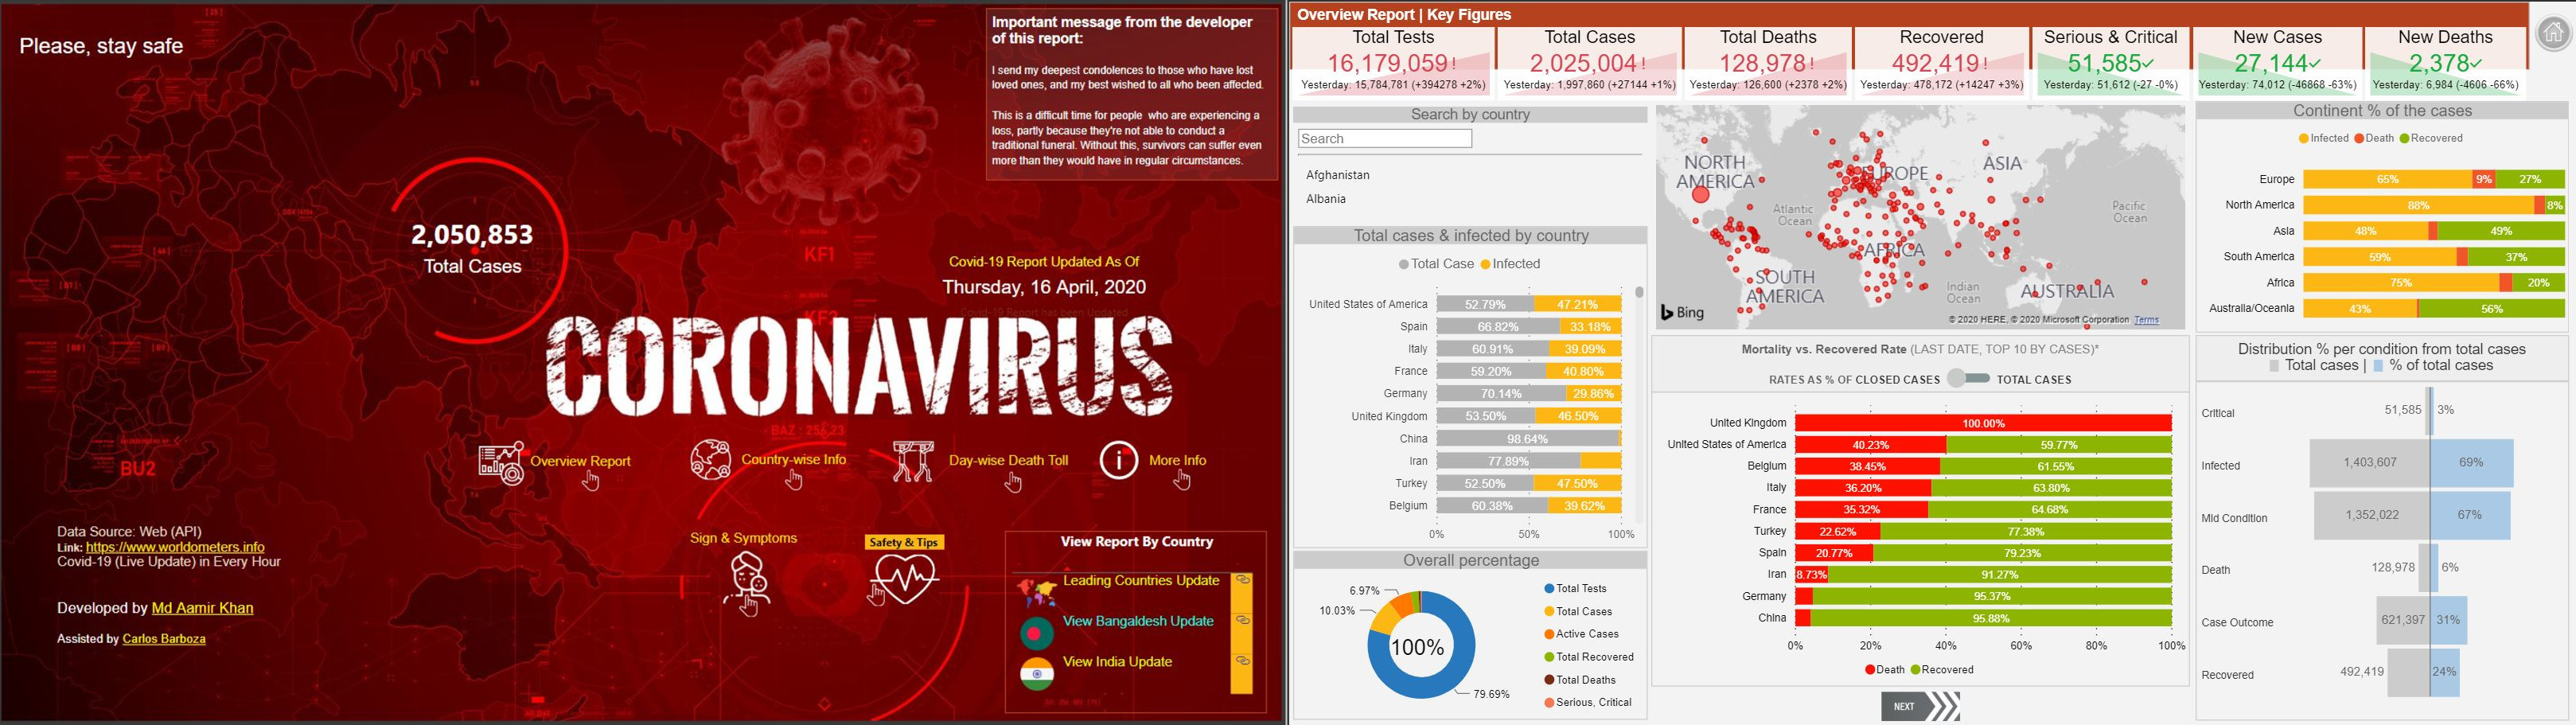
Coronavirus Globally Affected v2
Hello All,
After getting few feedbacks on my existing Covid-19 dashboard. I have updated my dashboard and release the new version of Covid-19 v2 dashboard.
Link: https://bit.ly/2XDijAE
Which includes a lot of information’s?
- Daily Cases: Map, daily cases over time vs avg Last 7 days, the avg last 7 days provide good insight on the current progression rate and allow us to potentially confirm if the peak has been reached yet.
- Cases by Country: Basic overview deaths/cases/recoveries by country and %increase over time.
- Closed Outcomes: Recovery rate vs death rate Stats by Population: Rate per one million inhabitants. Using the Unit/1M scale allows us to better compare each country disregarding their population size. Bringing all the countries to the same scale gives a completely different outcome!
- Figures since 30th case: The Covid-19 did not start to spread on the same day in all countries. Bringing all countries at the same starting point (day 1 since first 50th case or day 1 since 10th death) allow these comparisons.
- Forecast: Can we predict when the peak will be reached?
Please note, dashboard will refresh at daily basis (8 times a day)
eyJrIjoiYzlhYWM0NzctYTU1NS00MmQ4LWIwNDItY2JlZDI3NWE3MjBmIiwidCI6ImZjZjNkMzJkLWNhZTQtNDhmYi1iYjFmLTQ2NGQ1YWU3ODFhMiIsImMiOjEwfQ%3D%3D