- Power BI forums
- Updates
- News & Announcements
- Get Help with Power BI
- Desktop
- Service
- Report Server
- Power Query
- Mobile Apps
- Developer
- DAX Commands and Tips
- Custom Visuals Development Discussion
- Health and Life Sciences
- Power BI Spanish forums
- Translated Spanish Desktop
- Power Platform Integration - Better Together!
- Power Platform Integrations (Read-only)
- Power Platform and Dynamics 365 Integrations (Read-only)
- Training and Consulting
- Instructor Led Training
- Dashboard in a Day for Women, by Women
- Galleries
- Community Connections & How-To Videos
- COVID-19 Data Stories Gallery
- Themes Gallery
- Data Stories Gallery
- R Script Showcase
- Webinars and Video Gallery
- Quick Measures Gallery
- 2021 MSBizAppsSummit Gallery
- 2020 MSBizAppsSummit Gallery
- 2019 MSBizAppsSummit Gallery
- Events
- Ideas
- Custom Visuals Ideas
- Issues
- Issues
- Events
- Upcoming Events
- Community Blog
- Power BI Community Blog
- Custom Visuals Community Blog
- Community Support
- Community Accounts & Registration
- Using the Community
- Community Feedback
Register now to learn Fabric in free live sessions led by the best Microsoft experts. From Apr 16 to May 9, in English and Spanish.
- Power BI forums
- Galleries
- Data Stories Gallery
- Combining R and Microsoft Power BI


- Mark as New
- Bookmark
- Subscribe
- Mute
- Subscribe to RSS Feed
- Permalink
- Report Inappropriate Content
Combining R and Microsoft Power BI
Combining R and Microsoft Power BI
Combining R and Microsoft Power BI
I have to start with some buzzwords: Big Data, Cloud, Dashboards, Data Science, Data-Driven, Predictive Analytics, Artificial Intelligence, Machine Learning. Working for a finance organization we have to deal with million datasets already - does this mean that we are doing big data already? Good question -
Located in Silicon Valley I decided to explore all buzz words and joined a Data Visualization Summit in San Francisco #DataViz16. I was really impressed to see interactive dashboards and users are able to self-service their reports. This was an eye-opener for me - I decided to get more knowledge and set the vision to lead a dashboard implementation.
Stanford Continuing Studies offered an interesting course called "Tame Big Data to Drive Big Insight". Gauthier Vasseur gave really great insights and set the foundation for the next level.
At the same time, my company introduced Microsoft Power BI:
"Power BI is a business analytics service provided by Microsoft. It provides interactive visualizations with self-service business intelligence capabilities, where end users can create reports and dashboards by themselves, without having to depend on information technology staff or database administrators." [wikipedia.com]

Based on 2017 Gartner report, Power BI is one of the leading BI and Analytics Platforms.
I personally think there is a battle between Tableau and Power BI, and you can read pros and cons for both tools. But I don't need to argue or explore, my company implemented Power Bi and I really like the tool and the capabilities.
I spent several weekends and hours to explore Power BI, using DIAD events (dashboard in a day) and youtube. To become a Power BI pro you need to learn a new language, called Data Analysis Expressions (DAX) - my favorite channels are Curbal (maintained by Ruth Pozuelo Martinez) and Enterprise DNA (maintained by Sam McKay).
Stanford Continuing Studies offered another interesting course called "an introduction to data science". Mohammad Shokoohi-Yekta gave an hands-on training to R, which is a programming language for statistical computing and graphics.
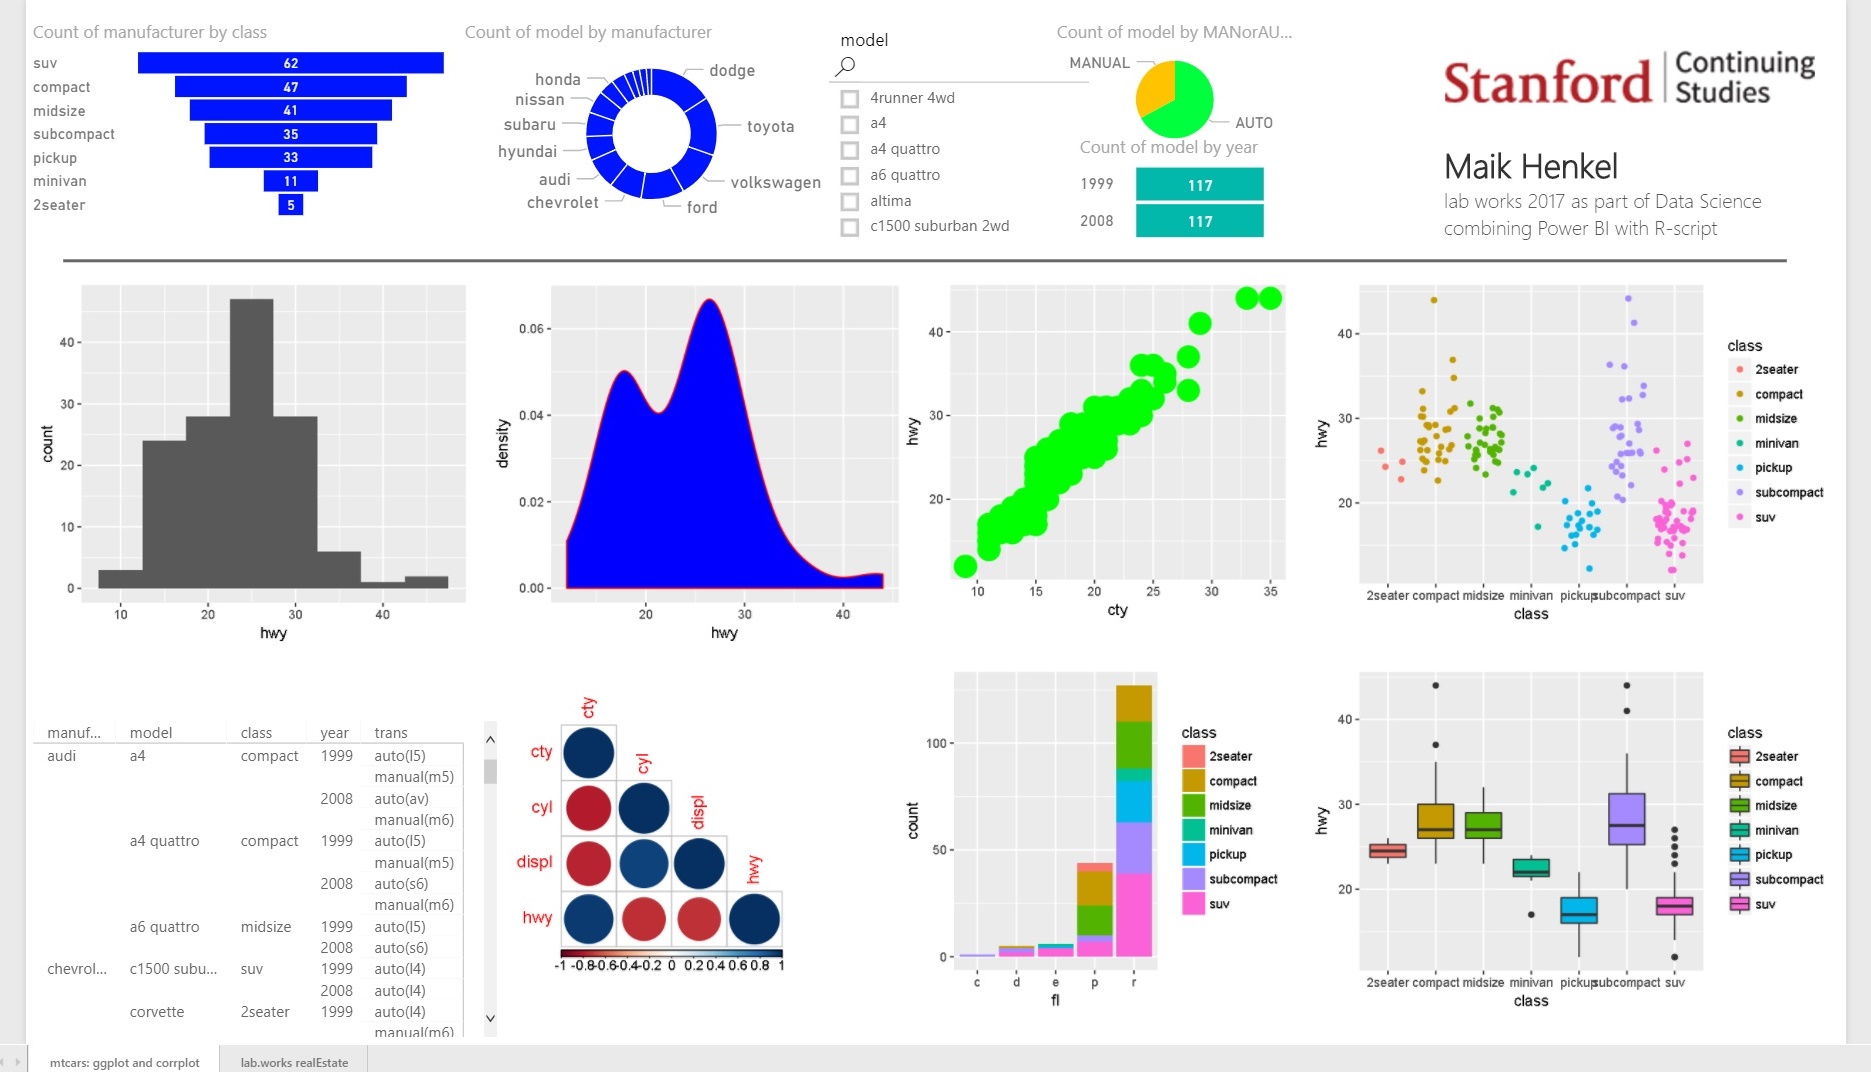
Having this knowledge on data science, data modeling, dashboarding, and statistical basics I decided to combine all together and showcased a dashboard as part of my Stanford assignment. Following screenshot shows the ggplot and corrplot visuals from R, combined with dashboard function in Power BI. For this view, I used the data set cars in R. The user can select any option in the header and all charts are updated based on the filter set. So, the user doesn't need to understand R language but can consume pre-defined views from R.
Please click on the picture to see a animated gif with different selections:

The ggplot package can visualize your data in different ways, above you can see ggplot using following option: geom_histogram, geom_density, geom_point, geom_jitter, geom_bar, geom_boxplot. With corrplot package you can find correlations between different datasets, see the bubble chart where you can visualize a strong correlation between highway and city mpg and a negative correlation for highway mpg and number of cylinders.
The next dashboard represents Real Estate Transactions and I used the ggplot package from R. The user can select number of bed rooms or bath rooms, or select a city and all charts would change based on the selection.

You can download the Power BI Desktop file, inclusive of full dataset under the following link. Please note that you need Power BI Desktop, R and R Studio installed locally to your computer plus you need to install ggplot and corrplot package in R Studio.
In reality, your customers don't need to download the power BI desktop file, you would publish your report to the web server and the user could consume the data without installing Desktop, R or any other package. These steps are only needed for developers.
eyJrIjoiZWFkZjVhMWQtMjQ0Mi00YzFlLTg4NWMtYzc1ZjNhNTViYjU5IiwidCI6ImZhOGRmYjBjLTk5ZTctNGNlYi1hMDcyLTk4MDk1ZmQxZWQwOSIsImMiOjZ9