- Power BI forums
- Updates
- News & Announcements
- Get Help with Power BI
- Desktop
- Service
- Report Server
- Power Query
- Mobile Apps
- Developer
- DAX Commands and Tips
- Custom Visuals Development Discussion
- Health and Life Sciences
- Power BI Spanish forums
- Translated Spanish Desktop
- Power Platform Integration - Better Together!
- Power Platform Integrations (Read-only)
- Power Platform and Dynamics 365 Integrations (Read-only)
- Training and Consulting
- Instructor Led Training
- Dashboard in a Day for Women, by Women
- Galleries
- Community Connections & How-To Videos
- COVID-19 Data Stories Gallery
- Themes Gallery
- Data Stories Gallery
- R Script Showcase
- Webinars and Video Gallery
- Quick Measures Gallery
- 2021 MSBizAppsSummit Gallery
- 2020 MSBizAppsSummit Gallery
- 2019 MSBizAppsSummit Gallery
- Events
- Ideas
- Custom Visuals Ideas
- Issues
- Issues
- Events
- Upcoming Events
- Community Blog
- Power BI Community Blog
- Custom Visuals Community Blog
- Community Support
- Community Accounts & Registration
- Using the Community
- Community Feedback
Register now to learn Fabric in free live sessions led by the best Microsoft experts. From Apr 16 to May 9, in English and Spanish.
- Power BI forums
- Galleries
- Data Stories Gallery
- Re: Change in U.S. Per Capita Consumption of Poult...

Re: Change in U.S. Per Capita Consumption of Poultry and Livestock
01-04-2018 10:28 AM


- Mark as New
- Bookmark
- Subscribe
- Mute
- Subscribe to RSS Feed
- Permalink
- Report Inappropriate Content
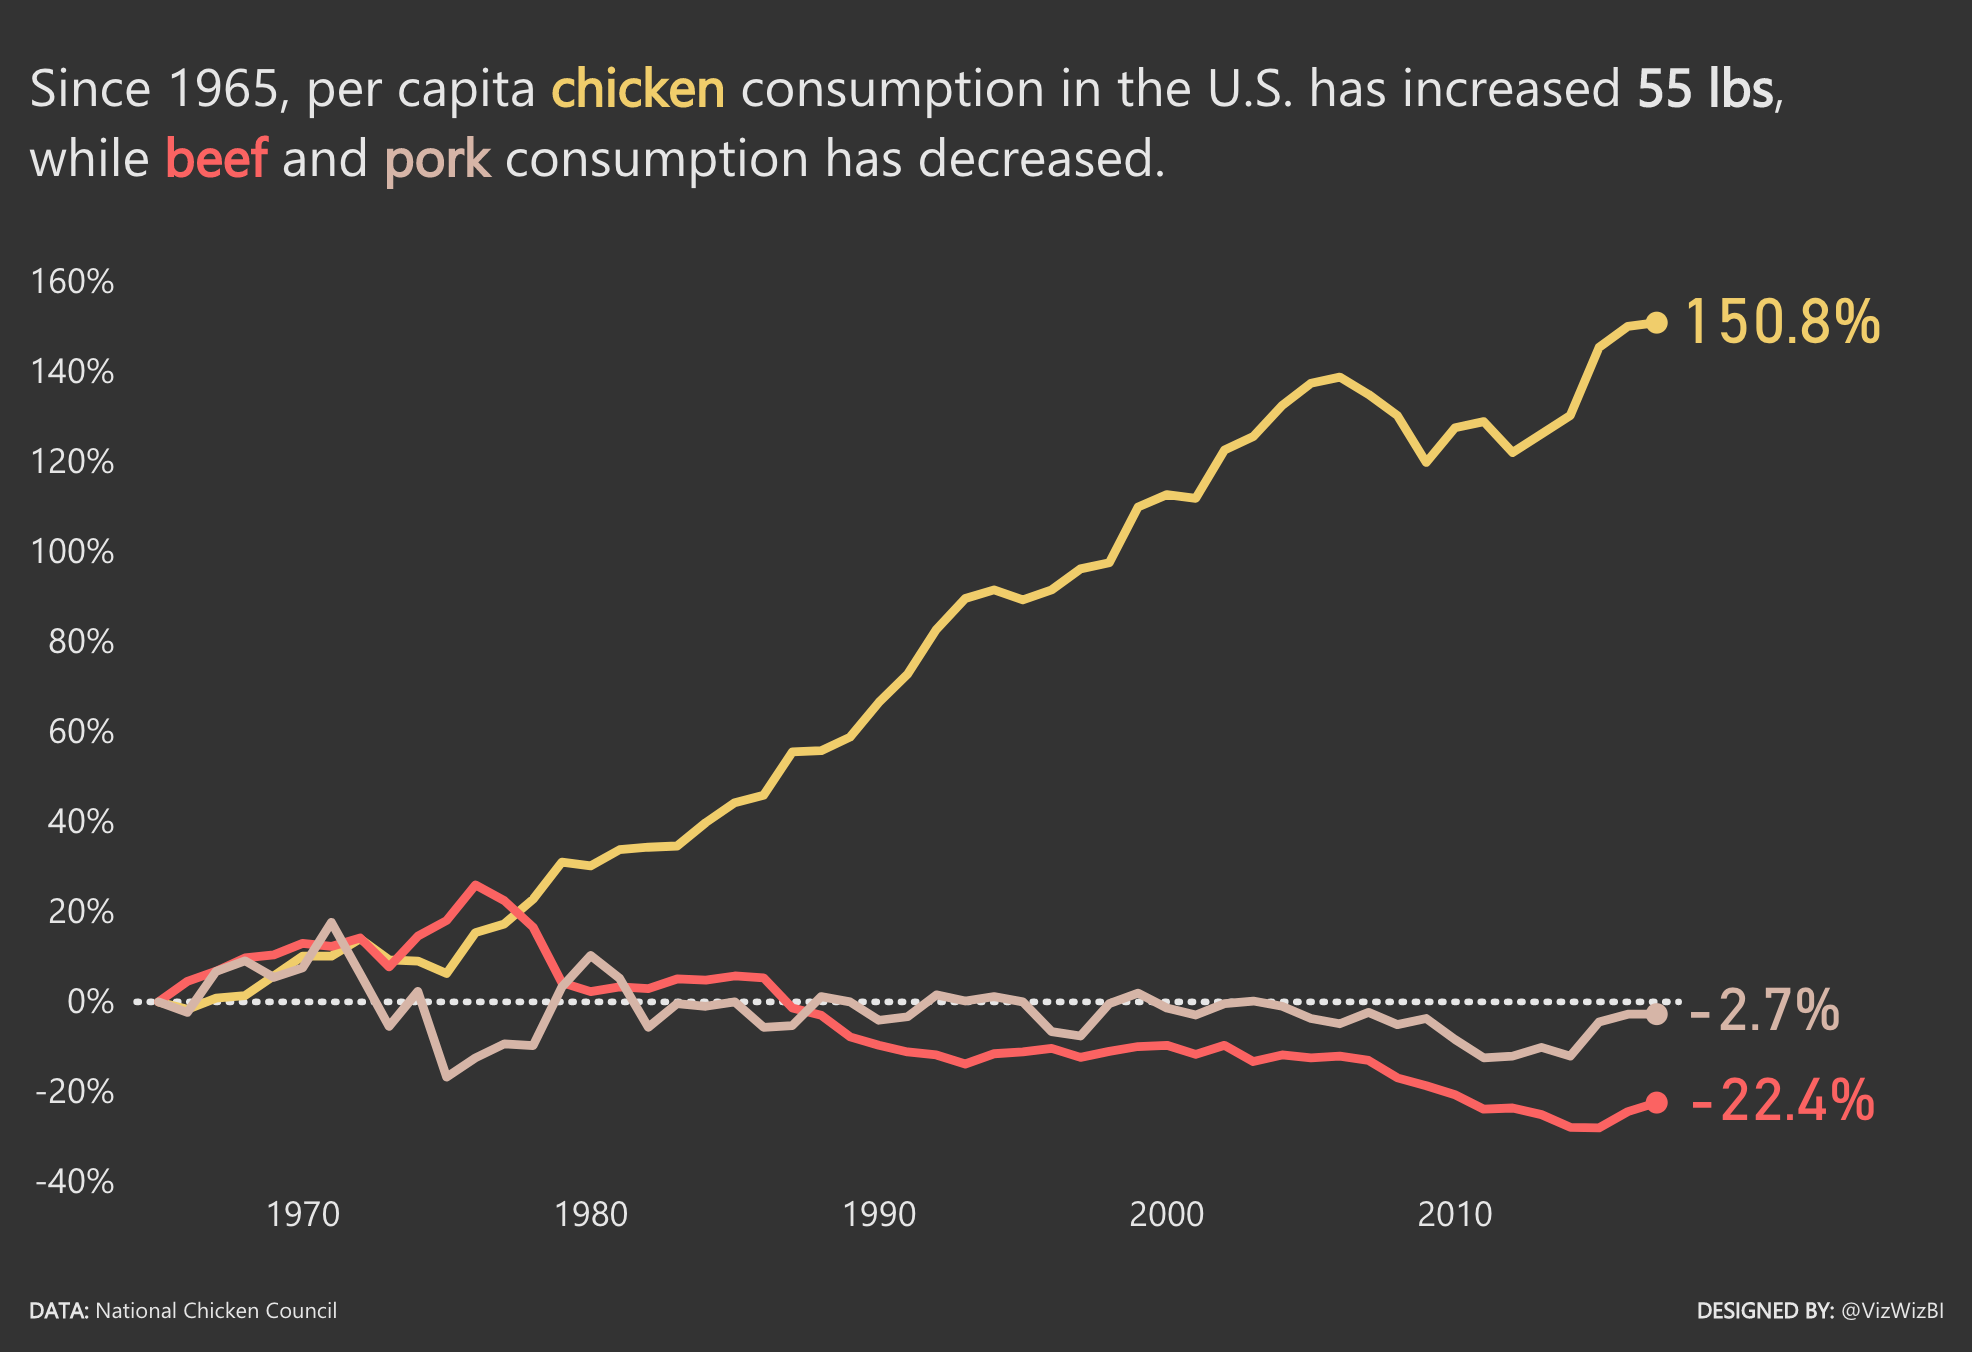
Change in U.S. Per Capita Consumption of Poultry and Livestock
This was my first experience using Power BI and I recreated a chart I made in Tableau for the Makeover Monday project. I also wrote about my experience on my blog here.
In this viz, I am looking at the change in chicken, beef and pork consumpton habits of Americans since 1965.
eyJrIjoiZTM0MWQ2MTAtZmUyYy00NWMwLWE3ZjUtZmFiYjAzY2VjZjA5IiwidCI6ImNlZjk5OTUzLWM0OTYtNGE4MS1iMDYxLTNlYmU1ODRjY2ZjYyIsImMiOjh9
- Mark as New
- Bookmark
- Subscribe
- Mute
- Subscribe to RSS Feed
- Permalink
- Report Inappropriate Content
Thanks for crossing over into different tools recently with Makeover Monday and detailing your experience with Power BI.
- Mark as New
- Bookmark
- Subscribe
- Mute
- Subscribe to RSS Feed
- Permalink
- Report Inappropriate Content
Thanks for crossing over into different tools recently with Makeover Monday and detailing your experience with Power BI.